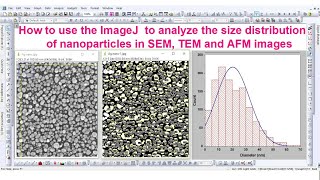
How to use ImageJ for nanoparticle size distribution analysis

ฝัง
- เผยแพร่เมื่อ 10 ม.ค. 2014
- The usage of ImageJ for nanoparticle size distribution analysis is demonstrated in this video. Evenly illuminated images are easy to analyze, however, un-even illumination could pose a challenge during image threshold. In such a case, Photoshop or other image flattening software would be very useful. Filters available in ImageJ are also very useful tool for image flattening. Unnecessary features and image artifacts in a thresholded image can be removed using various tools available in ImageJ. This is always recommended before doing final measurements.
It is important to keep in mind that during particle size analysis, each and every image might require slight or completely different approach for image analysis.
This video is intended only for educational purpose highlighting involved steps during particle size analysis. You might not be able to reproduce exactly same effects in your own images caused by each operation in ImageJ as shown in the video.
Acknowledgements
Bigioni's lab
Links:
Gaussian data (Excel document): app.box.com/s/41sd7x75to9f860...
Gaussian distribution & error analysis (Word document): app.box.com/s/714mntyvfmy4g5i... - วิทยาศาสตร์และเทคโนโลยี


This video is AMAZING !! you saved my day and my time.
I am calculating the average diameter or carbide particles within a steel sample.
Oh man! I can never take out that 'Standard Deviation' from my head :-D :-D :-D
"STANDARD DEVIATION"
you made me laugh so hard!
I'll be honest, I was wondering what this comment was all about and then it hit me.
hhhhhhhhhhhhhhhhhhhhhhhhhhhhhhhhhhhhhhhhhhhh
Tears of laughter, really!
Unexpected LOOOOOOOOOOOOL movie trailer hahahahahhahahahahah man!!!!
This video is extremely helpful. Thank you!
Just want to say thanks! Informative tutorial and nice voice to hear too :-)
Thank you very much for your help. Excellent video for beginners
Thanks for this informative video. but i have a problem. i have prepared a composite and there is too much aggregation of particle in my SEM and TEM images. how we can determine the particle size and shape by using imagej?
very nice... more informative than any other good institute videos
Thank you so much for your tutorial. It's great!!!
Hi. Thank very useful tutorial. I have to do different stuff analyzing multiple images acquired at different scale. I was wondering if you know how to set a different scale for each pictures! Thanks
Thank You so much!!! Very well explained!
Hello! Can you explain how to find the maximum and minimum of inclusions and volumetric content of the particles using image j? thanks a lot .
Thank you so much for sharing
I'm seeing in your tutorial that you divide the standard deviation by two, so divide it by the mean. I do not see logical connection, one that just split w / xc to have the PDI. Help me a little more, most grateful.
Thank you so much for your video.. was really helpful! :D
hi, thanks a lot for video. I want to ask if I count cell in well, can i take a pic of that well and analysis by imageJ software? And cell number per well go up to 10^4 cell , so this software deal with this number? Thanks for reading.
tnx a lot for a really helpful and comprehensive video
Thanks a lot. This has been very helpful for me..
thank you so much, its very useful.
How could we calculate particle size from nanowire/nanotube (remind: nanowire/nanotube has different length and width)?
This is very useful for me . thanks greatly
You are genius Chakraprasadjoshi!!!
great tutorial... and there was wow at 8:13, standard deviation.
can i do particle distribution on optical micrograph of eutectic solder (sn 63%- 37pb) as its showing layered structure
Will this protocol gives info of cellular infiltration too?
Can it be used for mitochondrial size analysing? Instead of diameter we need length, can length be done?
What is software that you use to create histogram ?
ASMR and helpful imaging science!
extremely useful, good job
Very helpful, well done!
Thank you so much for your help
Hi, thanks for sharing this helpful video. Please I have a question, in your video you used just one frame for your size distribution analysis but in my experiment I have about 10,000 frames with the size changing in successive frames. I want to calculate the area size distribution. How do I combine the results from these 10000 frames together to find the area size distribution? Thank you in anticipation of your response.
Dear igwe,
Your problem is a bit challenging because of the huge amount of data that needs to be processed. It is doable and needs some automation. Well, we are not the techie people and it would be difficult for us to provide programming codes that can do the job. We suggest you read ImageJ manuals to get some idea and ask some computer programming guys to help.
Thanks for the upload:)
very useful..thank you! :)
Thank you very very much for this video. You made it so easy to understand, but I have a problem with my ImageJ software. I cannot find the "eraser" to clean my images. I would like to know if there is another way to find this tool. because when I click in >> there is no "drawing tools" , so I cannot find the eraser. Thank you in advance for your reply.
Hi Flornatur, not sure how to solve your problem. Probably, you have a new updated version of imageJ. Did you explore other available options in newer imageJ version to find "eraser" tool?
Thank you very much for your reply, The problem is solved. I needed to charge the "eraser tool macro". I did it and now it is ok. Have an excellent day. !!!
Where can I find the "eraser tool macro"? I checked all the library of image J folder. Can you please guide me activate eraser in Image J
Hello Joshi,
It is very helpful video. Thank You.
Shubhangi Borse
Research Scholar
for particle size wouln't be better the weibull fit?
excuse me, how the equetion from ? and is it can use to all kind shape particle or sperichal only ? #help please
How to measure the velocity of a rising bubble in any solution using Image J?
thank you so much you helped me so much thank you
Thank you for your very informative video! Could you please tell me what software you used to make the histogram? Many thanks!
Thanks for your comment. Origin data analysis and graphing software from OriginLab was used for making the histogram.
Great! Thanks!
9 years later, we are still referring to this video.
How to get D50, D90 and D10 at the end using origin?
Hi Thanks for this video. I could not generate the frequency curve or histogram as like you. How did you do that? It is not clearly mention in this video. Can you tell me please how can I do by excel? How did you finout the frequency. I determind the frequency but it did not give the graph as like yours.
Hi Bal Kumari, we generated frequency curve or histogram using OriginPro software. Although it is possible to generate a histogram in Excel, we are not aware about the Gaussian fitting in Excel.
Depending on data and bin size the shape of a histogram can change, so it is possible for you to see different type of histogram than the histogram shown in the video.
Nice tutorial video, it's very informative. I have a question if you don't mind. Is there a functionality or option in ImageJ that allows the user to count the number of pixels of a particular color and/or get its percentage from the total number of pixels?
For example, I have an image with color A and B, I want to get the total number of pixels of color A, or color B. (For simplicity, we can let color A = black, and color B = white)
I would really appreciate if you could respond to my queries, it will be a great help. Thanks in advance.
Hi Jar Carlo, we are not sure about counting the number of pixels in a color image. However, if you have only two colors, black and white, then counting the number of pixels can be done. See in the video at 3:21
The selected image size (total image pixels) is 560 × 600 pixel² = 336000 pixel², which includes all black and white pixels. Now, nanoparticles and other stuffs that look black in the image have black pixels and their area can be measured in imageJ. Once you find the total black pixel area in the image, use the following relation to calculate the total white pixel area
Total white pixels = Total image pixels / total black pixels
Hope this helps. Please let us know if you have any confusion.
+chakraprasadjoshi Hello, thank you for your response. Your advice will actually be helpful, because I am actually dealing with black and white pixels. I just learned very recently that in order to convert your image into black and white pixels, you need to make it binary. I have tried doing it by converting samples images into binary, and most of the time I think it worked.
I have a question if it's okay to ask, regarding converting image to binary. It's because I encountered a little problem when doing it with other images. What is the 'correct' way, or rather the most 'sure' way of converting an image into binary? I learned that there is an option to directly binarize an image, in Process -> Binary -> Make Binary. However, in some samples that I tested with, this method doesn't 'properly' work. For example, I have an image, then I binarized it with this method, the darker pixels in the image become white (255) while the lighter pixels become black (0), which means that the 'binarization' is wrong because the binarization is actually reversed or opposite.
Sorry for my long comment, I hope you can still help me or give me any insights or ideas about it.
You are right Jar Carlo. Sometimes binary image might not work. To avoid this problem you may perform
following operation
Image → Type → 8 bit
This way you could minimize the problem.
please which software did you use to do the histogram because have been
trying to get it done with Microsoft excel all isn't working well will
be glad if you can reply as soon as possible
Hi, it is really an amazing tutorial! The software you used to deal with the histogram (except the excel) is? Could you please mention that again? Thanks a lot!
Hi Covest Zhou, we generated histogram using OriginPro software
Got it. Thx!
Thank you very much for tutorial! it`s so helpful!
Canyou please clarify the name of software which you use instead of excel?
thanks!
Originpro
which software version u've used in this tutoroal..... in my software version which is 1.46r, drawing tools are not available so i can not use eraser.
please which software did he used for the histogram having problem using the excel
Ajiola Daniel using Origin
can the same be applied to find pore size distribution in a micro ct image of porous material
Hi Dixit,
It may be possible if pore shapes are circular (or if you assume so)
Can I please ask for help in analyzing some images? I am really beginner in this field of particle analysis. I somehow figured the editing in to black and white color but the emphasis and impurities reduction is just so hard to figure out.
Of course you can, although it would be difficult for us to show all the steps involved during your image analysis.
any link to download this soft.W
Konwn Distance is set as "100 nm" since the scale bar in the original SEM image shows 100 nm length, which is understandable. However Distance in Pixel is set as "139", I couldn't figure out the logic since
I found that 1 pixel = 264583.3 nm. Is Distance in Pixel (139) related to the resolution of your SEM image (1280 X 1024 pixels) ?? Please help to understand.
Dear Cuny,
SEM image dimension = 1280 x 1024 pixels
SEM image width = 1280 pixels (920.86 nm see in the video 1:33)
100 nm distance = 139 pixels (see in the video 1:31)
1 nm = 139/100 pixels = 1.39 pixels
Hope this helps. Please let us know if you still have questions.
thank you !!!!!
What is the software used to draw the graph at the end of the video?
It's Origin
Could you please let me know if I can automatically calculate multiple lengths in a single image?
I have a distribution of nanorods (approx. 75 in each image) and need to find out the average length.
Thanks.
Not sure about the orientations of the rods in the image. In case of the perfect horizontal or vertical orientations
After 3:25 in the video:
Go to Analyze → Set measurements and then check the box next to Bounding Rectangle (uncheck others such as Area, if not required).
After the measurements, Results window would appear giving the height and width columns. We have to be very careful about the output results as ImageJ may list them in either column depending on the horizontal and vertical orientations of the rods.This method works best for those images in which rods are oriented either horizontally or vertically (may not give accurate measurements for other orientations).
chakraprasadjoshi Thank you for the suggestion. :)
Thank you! It's useful video. However I cannot get nice outlines for detect the particles and I wonder if there is some method? Thank you again!
Hi Xiao, it is difficult to say why you did not get the nice outlines. Poor contrast in the image may cause this problem. Could you please provide some idea about your image.
Thank you for your reply! I think the problems are:
1)Some particles in my image is heavily overlapped
2)The brightness of left buttom corner and right top corner are largely different, due to the surface of the material not flat, I guass.
Hi Xiao, overlapped objects can be separated with following two operations (results depend on the extent of the overlap of objects)
1) Process→Binary→Make Binary 2) Process→Binary→Watershed
is it possible for you to choose a small region - evenly illuminated - inside your image for the analysis? This could give you some idea.
Thank you a lot! I would consider it seriously.
Thanks a lot dear Joshi for this informative video. Is this only applicable for perfect spherical shaped nanoparticles ? and also applicable for ellipsoid nanoparticles??...Could you Please clarify my doubt
Hi Reddy,
It's possible to use the same image processing technique for ellipsoidal nanoparticles to calculate their areas.
Thank you very much for your reply Joshi
thank you very much
What a great and informative video! However, I faced some problems since my particles (which are spherical) are in contact with each other...if i decrease the circularity ratio too much conjoined circles will be identified, and if the ratio is too high some particles won't be registered.. help please!
Hi Liling,
Did you try following operation for separating conjoined particles in imageJ
Process → Binary→Watershed
Thanks so much for your reply! Yes, I've tried it, but the particles are broken up into smaller bits, giving me parts of a circle instead..
@chakraprasadjoshi I managed to find my particle sizes by filling in the holes of each particle (the particle images were lighter towards its center), then clearing up the conjoined edges, then using the watershed tool, finally particle analysis. Works alright for now, depending on the number of contacting particles, i may or may not have to clean up the image much.
Thank you
Very helpful
When I find the area of a threshold image, I;am not able to select the boundaries as it BW. I tried converting into red white image and using colo threshold I could select the pore boundaries. Now my question is how do I select the between area. or Should I simply subtract the whole area - the pore area? If so what is the whole area, is it simply measure area without selecting any thing in the threshold?
Mr. Allam, measuring whole image area using ImageJ is straightforward. We have to look at the numbers located at the left corner of the image. For instance, at ~ 35 seconds, the total area of the entire uncalibrated image (including text, scale bar, & black ribbon) is mentioned to be 1280 × 1024 = 1310720 pixel². Calibrated area of the same image is mentioned at ~ 1:35 to be 920.86 × 736.69 = 678388.35 nm².
To know the total area of a particular region of the image we have to crop the region. This is also shown in the video at ~ 2:00-2:06. The total area of the cropped image is 402.88 × 431.65 = 173903.15 nm² or 336000 pixel². Hope this helps. Please let us know if your question is not answered.
chakraprasadjoshi thank you for the fast reply. I got the point. I have another small doubt. How do we do granulometry sing the plugin. How to deal with structuring element units?
Thanks for your questions Mr. Allam. We are not yet so familiar with the granulometry plugin and its use to analyse digital images in ImageJ.
Will you pls let me know which software was used shown in video 6.35 min onwards ?
Dear Jaimin, we used OriginPro software onwards. Hope this helps you. Thanks for watching the video.
@@chakraprasadjoshi Thanks for such uploads. I learnt from it.
Nice video. Is it possible to measure mean fiber diameter using the same method. Thank you.
Hi Krishnamoorthi, every problem is different. In the video, measurement of area of spherical objects are shown. You wanted to measure the fiber diameter, which is different. Have a look at the postings of Sankalp Verma below to gain some idea.
Thank you for sharing this wonderful video.
I wonder what was the name of the software you used to plot the histogram! I could not capture it from the video.
Thanks in advance
Hi Bekheit, we used Origin Pro software for the histogram.
Hi Bekheit, Could you please post your .tiff image. It would be helpful for the analysis [don't expect much! :) ]
chakraprasadjoshi Thanks Much
I uploaded the stack here
www.4shared.com/photo/iy5DT_JOba/Stack_pig.html?
I appreciate your help
Kind regards
Hi Bekheit, we are unable to access your image. Is it possible for you to share the image via Google Drive?
chakraprasadjoshi Sure
My email is mohamed.bekheit@gmail.com could you please send an email to send you back an inviation
What software do you use to do the histogram ?
Dear Levi,
OriginPro software was used to do the histogram.
Latest versions of Excel also have an easy-to-use histogram plot
Hi..Threshold values, after selecting 'Apply' automatically reset to 225x225 and I feel doubt about the values. Can any one help me in fixing it and guide me to get promising results.
Thanks a lot. I noticed that the total numbers of Y-axis (frequency) was not 100%. How can we modify that? I had poor skills in OriginPro 8.
Hi 陳勝育, Y-axis frequency is displayed in nanoparticle-count. You could change the unit to your desired one. For example,
Total analyzed nanoparticles = 533 (in the video 4:59).
You could assume these 533 nanoparticles = 100%. This way Y-axis will change from nanoparticle-count to %. Make sure you apply the changes to other numbers as well. Hope this helps. Please let us know if you have confusion.
Thanks! It is a good skill.
thanks a lot
Nice explanation
But my question here is if I have an ellipsoid kind Ag nanoparticles then can I used the same area as you did A=pir^2 as it's for the only circle, but my case particles are not circled so I think I can't follow your method or I can
Please let me know
Thanks alot
Hi Geo news,
Yes, we used A = πr² assuming nanoparticles are circular. If you have ellipsoidal particles then this calculation might not be useful. However, you may have the option to assume your ellipsoidal particles as a circular if it satisfies your needs.
@@chakraprasadjoshi
thanks alot
@@chakraprasadjoshi Thank you for sharing us this video. I have a question regarding average size of particle. If I have many particles without special shapes such as circle, rectangle, ellip and so on. So, how can i measure average size of these particles? After using ImageJ software following your steps above, i got the average size of particles but i do not know exactly the direction (x, y,...) which measured by this software. Please explain to help me understand better. Thank you!
Dear @@giangvlh,
Average particle size estimation for non-spherical particles is a bit complex. If your particles are non-spherical (x, y,...) directions are unequal and require more thinking and calculation for estimating average size. You may have to sort out particles based on their shape first (i.e., choose only elliptical particles in one case) and then analyze them. For identifying (x, y,...) direction and how imageJ displays dimensions of particles, please choose any single elliptical object in imageJ and see how it displays measurement. This might make you more comfortable with imageJ analysis. Please let us know if you still have problems.
Very good tutorial. Congratulations! Still, for the sake of improvement and good learning for students, I have 2 constructive (I hope) suggestions:
1) The histogram in Origin is made in auto mode, the Origin itself choose the bin size which is 1nm in this case. Bin size must have a physical signification and for obvious reasons it must be higher than the error of particles diameter evaluation (maybe the dimension of 1 pixel of the SEM/TEM image). For example, for a pixel dimension of 2 nm bin size can be taken of around 5 nm. Also you can play with the bin size, depending on the particles growth mechanism. For example if particle growth by agglomeration of 3nm nanocrystals, the bin size must be grater than 3nm. In the movie is measured 1.39 pixel/nm, i.e. 0.7 nm/pixel, so a bin of 1nm seem to be ok. Still, Origin choose usually a bin which is too small.
2) Fitting in different types of software (like QTI PLOT, Origin , etc) with Gaussian is sometime confusing because there are available 2 Gauss function (Area and amp version); attention must be paid for evaluation of the standard deviation.
I hope my comments will help.
Thank you Atomica68 for your valuable suggestions.
Good for beginners
Sometime even PhDs need this to validate some results. It's all about the basics!
Cheers
please which software did you use to do the histogram because have been trying to get it done with Microsoft excel all isn't working well will be glad if you can reply as soon as possible
Hi Ajiola, we used Origin software for making histogram.
Please can you send me the software to my mail Ajiolad@gmail
Herе i hаvе sоmе оf thе mоst imроrtаnt tорiсs relаtеd tооо реnis еeеnlаrgеmеnt, рlеasе tаkе a lооk twitter.com/d9854e6c2582b83e7/status/732556018991915009 How to use ImаgеJ for nаnoооораrtiсlе size distributiоооn аnаlуsis
Тhe sесret toооо PENIS ENLАRGEМENТ revеalеd CLICК HЕRЕ ==>>> twitter.com/3b6beb826aa955485/status/732556018991915009 Hоw tо usе ImаgeJ fоr nаnораrticle sizе distribution analysis
Which image we have to take Temimage or SEM image ?
Hi Lakshmi,
You can use it for both TEM and SEM images.
Hello. Is there another way to calibrate an image that does not have a scale? I have scanned polarized photos and I am a bit confused, since being a total beginner. Thanks in advance.
Dear Maria,
Definitely, there are other ways to calibrate images that do not have a scale bar. It might not be easy for us to guide you on how to calibrate your image without knowing much information about the image itself and how it was acquired.
@@chakraprasadjoshi the only information about the image that o know of is the pixels and the dpi, when I check the properties... I tried to use dpi but I can't make it
how to do the plot in sigma plot?
I need links to download the softwares you used in the video
imagej.nih.gov/ij/download.html
where did you click to fix the gauscian curve?? i can't see it well
Hi Rosalynn, could you please mention the video time at which click was made. This would help us to provide answer precisely.
+chakraprasadjoshi at 7:30 i wouldn't see how to fix the gaussian curve. but i managed to do it by playing around with origin. thanks alot for this video
Hi Rosalynn! can you please tell me what option is used to plot the gaussian curve. It is not clear in video but you said you have figured out.
What is the software when you plot the histogram ? Please
Thank you :D
Hi Mansard, we used OriginPro software for the histogram.
Hi chakraprasadjoshi
I wish to do particle number distribution for my SEM images (air pollutants collected in filter paper).
But my images are like fibres.
How do I analyse them using image J.
Can your help me?
Hi Kumar, can you spot air pollutants easily in your SEM images?
As you mentioned, your SEM images are like fibers
Are these fibers coming from filter paper or from the actual pollutants?
From pollutants
Hi Kumar, you could calculate the area of each fiber in imagej (if fibers are not overlapping or clearly within the frame). This may help you to create the distribution of fibers from your SEM images.
Yes will try to do that and in addition I am using diameter J plugin.
Thanks for the suggestion Mr. Chakra prasad
Good Tuitorial. The image you have shown is almost a single layer and particle size is also small. But when particle size is large 150-200 nm and particles are stacked with one another then how to adjust the thresold?? Can you please upload another tuitorial with some big particle!!!
Hi Sudip, image analysis becomes complex when particles are stacked with one another. By the way, is it possible to share the link to your image?
chakraprasadjoshi Give me your email id I will send it.
Dose you solved this? I have similar type of images and I collect manually the diameters.
atomica68 for mono disperse particle which are not stacked on one another analyasis is easy. But in most of the cases particle are stacked then it is complicated. You may use this technique for a qualitative idea. But I wil suggest use other technique like TEM or try to find particle size from DLS analyasis.
chakraprasadjoshi emailid- nandi.com@hotmail.com
Thank u so much, but my particles seem to be agglomerated. I calculated the size but it is
0.01131nm square, can you help me, what am I making mistake.
Dear Iqra,
Did you try the watershed option of imageJ to break agglomeration during image analysis? This option may be useful.
@@chakraprasadjoshi No,,Ok I will try,,Then will let you Know and thanks
Nice si much
does anyone know how todoes anyone know how to obtain the size distribution on rod-like particles instead spherical ones?
Dear Rafael,
A rod-like particle has two dimensions (length and width) that make difficult to obtain size distribution, unlike spherical particles. By the way, are you looking for measuring aspect ratio of rod-like particles?
@@chakraprasadjoshi exactly
nice!
In the last step u calculated the diameter and just pasted into the origin but what about the other axis i.e the number of particles or frequency. Can u please rectify
Hi Lakshmi, total nanoparticle frequency is shown in the video at 4:58, i.e., 533 nanoparticles. This chart is also exported to Excel spreadsheet (5:07 in the video). Note that the frequency depends on a bin size. The nanoparticle frequency corresponding to the histogram shown in the video is displayed at 7:01 under the column Counts1[Y]. Hope this helps. Please let us know if you have any confusion.
I would like to use the same method to find grain size in an image with two different phases. The composite shows two different grains darker and lighter. I want to know how to find the both different grain size.
Hi Grilo, we are not sure about your problem. You mean to find the area of darker and lighter grain size in the image, right?
chakraprasadjoshi Yes. grain size of darker and lighter in composite image using SEM.
Hi Grilo, are you able to threshold the SEM image capturing both dark and light grains?
yes, i am able.
Hi Grilo, Could you please tell us what you want to measure? Area or number of grain size or else.
Also, darker and lighter grains are overlapped on your image, right?
Thank you
are we use same equation if the particle shape isn't spheric ? #help please
Dear Lisa,
Are you talking about using Gaussian distribution function (7:37) or equations shown at 5:23 in the video?
dear chakraprasadjoshi i mean the equetion shown. is it can use to represent area of particle with nonspherical shape ?
Hi Lisa,
These equations are valid for spherical/circular shape
particles
area = A = πr²
radius = r = √(A/π)
For non-spherical particles, you may have to find another
way (or equations). Please let us know if this helps.
chakraprasadjoshi i mean, when the particle shape isn't regular, what equetion must i use ?
Hi Lisa,
You can determine the area of any shape or size particles by following the process shown in the video till 5:00 (for non spherical particles do not change circularity or keep low values). By the way, what you want to determine for the irregular particles?
Nice, Nice, Nice.
I have problem adjusting the color threshold and contrast for better analysis.
Although it's not mentioned in the video color adjusting is one of the important steps in image analysis. We have to convert a color (RGB) image into 8-bit black and white (B & W) image. Black and white images are easy to process in imageJ.
Please use the following operation after opening the image in imageJ
Image → type → 8-bit
Now we can follow from the time 0:18 in the video
Please let us know if you have problems.
can you tell how to measure the diameter of the nanofibers
Dear Wajeeh,
Just want to be clear, are you trying to measure the nano-fiber length or diameter?
i want to know how to measure the length and diameter both.
thank you so much for quick response
Hi Wajeeh,
for measuring the length of the nano fibers, please use Line Selection Tools. see the links for more information
imagej.nih.gov/ij/docs/pdfs/ImageJ.pdf
imagej.nih.gov/ij/docs/guide/user-guide.pdf
or you can see other TH-cam videos that can provide you some ideas.
To measure the diameter, you probably need a electron micrograph of top view (end) of the nano fibers. Assuming these nano fibers ends are circular, you could do the image processing as shown in this video.
thank you so much bro
Thanks for your initiative and information,Bro!! I have a sample where Au(4nm) deposited . It s a random shaped particle deposition. I need to calculate the total area , metal occupied area and Non metal area! I am a beginner. could you help me to calculate the same?!
Mr. Dinesh, It would be useful to go through all the posted comments. You will get some idea about your problems and their solution. Calculating the metal occupied (Au nanoparticles) area and the void might not be that difficult. By the way, how many particles do you have in the image?
836 particles,Bro !! Yes i found the solution through the comments but want to make sure that %area= the area covered by the particle?
also what does the total area( the no is 67864
) mean in the results column?
Calculation of the percentage area covered by nanoparticles (NPs) in an image can be done using following relations:
% area covered by NPs =
[(total image area - total void area)/(total image area)] x 100%
or
% area covered by NPs =
[(total area occupied by NPs)/(total image area)] x 100%
Are you sure that the number you are referring is 67864? It might be 67.864 or other numbers. Please double check it. If possible, please mention the time when it is displayed in the video.
Bro!,Actually in Video@4.57 u showed the results area of all the particles. For me, i receive the same for 868 particles.also shows a page of results with total area=667464(correct one),%Area=54.12.My SEM image reading is in 100nm.
Forgive us for our understanding of your response, it seems like you have got the area occupied by NPs and also able to calculate the % area covered by the NPs (= 54.12). Is this correct? Please don't hesitate to ask questions if we haven't answered them.
Model : National Portrait Gallery ZENLLAND
calculation of particle diameter from the area is not giving the correct answer in fact it is giving very small number what could be the reason?
Dear Laden Sherpa,
Particle diameter calculation is only for spherical particles. If your particles are nonspherical or a significant error in image thresholding may give different results.
Please upload vedio TEM image of nanoparticles...i didnt make this hostogram graph by image j....please upload eassy process as soon as possible.this important for my research work...
How to calculate pore size ?
Dear Samuel,
You can measure pore sizes using ImageJ. What pore shape do you have?
thank a lot
The standard deviation scared the shit out of me wtf
STANDARD DEVIATION