Good! Make a square --> analyze --> tools --> ROI manager --> add --> rename. Edit --> selection --> specify --> fill width & height --> OK --> add -->rename. Click the ROI manager (directing to our self made square) when we want to measure.
Hi, thank you for the great video, it was very helpful. Can you explain how I can merge several ROIs into one ROI and measure it? I'm working on a tissue and there are more than 20 ROIs, which I selected using the Freehand selection tool. I've tried the "OR (Combine)" option under the "More" button of the ROI manager, but I still seem to get the ROIs separately. Thanks
Thanks for the useful video. How can i measure the difference in GFP signal intensity inside and outside of cell. To mark the boundary, cell membrane is labeled with RFP. Thanks
Hi. If you only have a few cells, use the region drawing tool to define inside and outside regions for measurement. If you have lots of images you could try using thresholding but that would only work if there was a clearly different range of intensities inside and out. Difficult to answer without seeing the images.
Hi, Thanks for the nice video. I cant see all the selections in my image at the same time. When I select one square, then the other one goes. How can I see all the selections in a single image so that I can save the pic with all selections.
Hi. You need to use the Region of Interest (ROI) manager. If you are using ImageJ it is at [Analyze/Tools/ROI manager]. When you make a new region select 'Add'. Once you have multiple regions check the 'Show All' box on the manager window. Cant remember where it is in Fiji but should be easy to find.
Very informative video, thanks! If we are comparing two sets of images, how would we account for differences in cell counts? For example, I am comparing mitochondrial mass between two subjects, how would I account for differences in cell numbers? (Cell numbers change throughout the course of a differentiation experiment, hence I could not keep them equal. Hope my question is clear
Hi, do you have a cell marker (like a nuclear stain) that gives you cell number? You would need that so you can express your mitochondrial density as a proportion of cell number to get an estimate of mitochondrial volume per cell. That's my best guess without seeing your images or with limited insight into your experimental setup. Regards. Craig.
Hello, I'm doing a science fair project about the best homemade stain remover. I heard that I can compare the intensity of the stain before and after I apply the stain remover. Do you have any ideas on what to do? It'll be very appreciated. Thanks!
Hi, can you take a laptop to the science fair? I’d suggest having a laptop loaded with ImageJ or Fiji (both are free). Use a mobile phone to take before and after pictures but also include a ruler or other object in the frame, or just make sure the pictures are a similar as possible (magnification). Email the two picture to the laptop. Load them in to ImageJ and crop as required. Then follow the guide on measuring intensity on this channel. I’m guessing for a science fair it doesn’t have to be super accurate just quick and interesting. Good luck.
@@CraigDaly Thanks for your response! I'm analyzing the data at home so there's no need to take it to school. I'm having trouble understanding the value of the integrated density. Do I use the mean value or the IntDen? What are the units? Thanks again!
@@michelgarcia3240 hi, if the images are 8-bit then every pixel in the image has a value between 0-255 to represent intensity where 0=black and 255=white, then every shade of gray sits between these. In any given region you can obtain the mean value of the pixels which of course must be somewhere between 0-255. The integrated density can be much larger as it is the sum of all the pixels in the image or chosen region. Which value you use will be determined by which is most appropriate for the experiment. In your case I would just go with the value that shows the greatest difference. However, mean is often better simply because you are working with smaller numbers.
Thanks. Good point about BG subtraction. I should have included that. Thresholding is dealt with in the measuring shapes and co-localisation tutorials. Hopefully watching all the tutorials should help folk to piece it all together.
Hi, the unit is the binary value of intensity. Every 8bit image has a pixel value between 0 and 255 to represent black (0) to white (255). So the units are intensity values expressed as an 8bit number. Craig
Hi, yes if your brown pigment has sufficient contrast. Try making your image 8-bit grayscale and then invert it. Your brown staining should then look like a bright object. Alternatively keep the image as RGB and use ‘Colour Thresholding’. Thanks for stoping by. Craig.
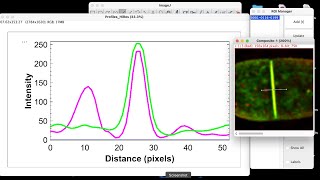
Hi. In this particular case comparing intensity in the boxes tells us about the amount of binding of two different coloured (fluorescent) drugs in the same sample. Different biological applications and samples will require further manipulation of the numbers. The tutorial video only attempts to show how the numbers are collected. Thanks for watching.
It really depends on the scientific question being asked. I would tend to take both measurements. Total (integrated) intensity and mean intensity will tell you different things. If you have large areas of black (ie no intensity) then the mean value will be skewed by those zero values. Probably the most important aspect is that the images being compared were captured under identical conditions.
@@CraigDaly They are captured under identical conditions. Each image has cells expressing fluorescent protein localized to their membranes. There are black spaces between the cells. I just want to compare the total fluorescence in each image.
@@vimalramachandran Ok, sounds like you should threshold the images and then measure the fluorescence under the thresholded region, to avoid measuring the black space. The 'Digital Images and measuring shapes' tutorial will show you how to use the threshold function. 'Set Measurements' option in ImageJ has a checkbox for 'limit to threshold' so you would need that to be checked.


Thank you, professor Craig!
Good! Make a square --> analyze --> tools --> ROI manager --> add --> rename. Edit --> selection --> specify --> fill width & height --> OK --> add -->rename. Click the ROI manager (directing to our self made square) when we want to measure.
Analyze--> set measurement (choose) --> ok. Then, analyze --> measure.
Hi, thank you for the great video, it was very helpful. Can you explain how I can merge several ROIs into one ROI and measure it? I'm working on a tissue and there are more than 20 ROIs, which I selected using the Freehand selection tool. I've tried the "OR (Combine)" option under the "More" button of the ROI manager, but I still seem to get the ROIs separately. Thanks
Hi, sorry for the slow response. If you hold down the shift key whilst creating regions they will be combined when you make the measurement. C
@@CraigDaly Thank you very much for your response.
Thanks for the useful video. How can i measure the difference in GFP signal intensity inside and outside of cell. To mark the boundary, cell membrane is labeled with RFP. Thanks
Hi. If you only have a few cells, use the region drawing tool to define inside and outside regions for measurement. If you have lots of images you could try using thresholding but that would only work if there was a clearly different range of intensities inside and out. Difficult to answer without seeing the images.
Hi, Thanks for the nice video. I cant see all the selections in my image at the same time. When I select one square, then the other one goes. How can I see all the selections in a single image so that I can save the pic with all selections.
Hi. You need to use the Region of Interest (ROI) manager. If you are using ImageJ it is at [Analyze/Tools/ROI manager]. When you make a new region select 'Add'. Once you have multiple regions check the 'Show All' box on the manager window. Cant remember where it is in Fiji but should be easy to find.
Very informative video, thanks! If we are comparing two sets of images, how would we account for differences in cell counts? For example, I am comparing mitochondrial mass between two subjects, how would I account for differences in cell numbers? (Cell numbers change throughout the course of a differentiation experiment, hence I could not keep them equal. Hope my question is clear
Hi, do you have a cell marker (like a nuclear stain) that gives you cell number? You would need that so you can express your mitochondrial density as a proportion of cell number to get an estimate of mitochondrial volume per cell. That's my best guess without seeing your images or with limited insight into your experimental setup. Regards. Craig.
@@CraigDaly well noted, yes I agree, I normalized the values to cell counts based on dapi staining , thanks
Hello Sir, thank you very much for this explanation!! This was really helpful for building my concepts. Regards.
Great. I’m pleased it was helpful. C.
Yes Sir!
It was really so simple and informative 🙏🙏!
Hi, Can I use these mean values to calculate the relative intensity for plotting the graph?
Hi, yes, you can certainly graph the mean values. Maybe also think about graphing the 'integrated Density' which is a measure of total intensity.
Thanks for the response😊
Hello, I'm doing a science fair project about the best homemade stain remover. I heard that I can compare the intensity of the stain before and after I apply the stain remover. Do you have any ideas on what to do? It'll be very appreciated. Thanks!
Hi, can you take a laptop to the science fair? I’d suggest having a laptop loaded with ImageJ or Fiji (both are free). Use a mobile phone to take before and after pictures but also include a ruler or other object in the frame, or just make sure the pictures are a similar as possible (magnification). Email the two picture to the laptop. Load them in to ImageJ and crop as required. Then follow the guide on measuring intensity on this channel. I’m guessing for a science fair it doesn’t have to be super accurate just quick and interesting. Good luck.
Oh, and remember to tell everyone at the science fair about the cool TH-cam channel you found 👍
@@CraigDaly Thanks for your response! I'm analyzing the data at home so there's no need to take it to school. I'm having trouble understanding the value of the integrated density. Do I use the mean value or the IntDen? What are the units? Thanks again!
@@michelgarcia3240 hi, if the images are 8-bit then every pixel in the image has a value between 0-255 to represent intensity where 0=black and 255=white, then every shade of gray sits between these. In any given region you can obtain the mean value of the pixels which of course must be somewhere between 0-255. The integrated density can be much larger as it is the sum of all the pixels in the image or chosen region. Which value you use will be determined by which is most appropriate for the experiment. In your case I would just go with the value that shows the greatest difference. However, mean is often better simply because you are working with smaller numbers.
@@CraigDaly Thank you so much for helping me!
nice video but what about background subtraction and threshold?
Thanks. Good point about BG subtraction. I should have included that. Thresholding is dealt with in the measuring shapes and co-localisation tutorials. Hopefully watching all the tutorials should help folk to piece it all together.
What is the unit for the mean gray value?
Hi, the unit is the binary value of intensity. Every 8bit image has a pixel value between 0 and 255 to represent black (0) to white (255). So the units are intensity values expressed as an 8bit number. Craig
is it useful in measuring intenisty of brown pigment any colour i want
Hi, yes if your brown pigment has sufficient contrast. Try making your image 8-bit grayscale and then invert it. Your brown staining should then look like a bright object. Alternatively keep the image as RGB and use ‘Colour Thresholding’. Thanks for stoping by. Craig.
Nice ....do more videos..and help us
Thanks. Anything specific you would like to see?
@@CraigDaly I will say latter
Not explained in full. What do you do after getting those values? Which one to compare?
Hi. In this particular case comparing intensity in the boxes tells us about the amount of binding of two different coloured (fluorescent) drugs in the same sample. Different biological applications and samples will require further manipulation of the numbers. The tutorial video only attempts to show how the numbers are collected. Thanks for watching.
@@CraigDaly If I want to ascertain the fluorescence in the entire image (not in a particular area), should I compare the integrated density or mean?
It really depends on the scientific question being asked. I would tend to take both measurements. Total (integrated) intensity and mean intensity will tell you different things. If you have large areas of black (ie no intensity) then the mean value will be skewed by those zero values. Probably the most important aspect is that the images being compared were captured under identical conditions.
@@CraigDaly They are captured under identical conditions. Each image has cells expressing fluorescent protein localized to their membranes. There are black spaces between the cells. I just want to compare the total fluorescence in each image.
@@vimalramachandran Ok, sounds like you should threshold the images and then measure the fluorescence under the thresholded region, to avoid measuring the black space. The 'Digital Images and measuring shapes' tutorial will show you how to use the threshold function. 'Set Measurements' option in ImageJ has a checkbox for 'limit to threshold' so you would need that to be checked.
Hello
How to calculate correction factor (multiplier)?
Hi, could give a bit more detail on context. I’m a bit unclear on what you are asking. Thanks. C