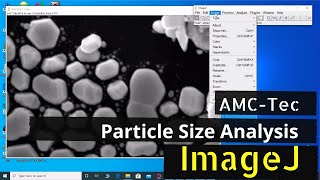
ImageJ - Scanning Electron Microscope (SEM) Image Analysis (Basic) - Particle Size | AMC-Tec |

ฝัง
- เผยแพร่เมื่อ 6 มิ.ย. 2020
- Scanning Electron Microscope (SEM) Image Analysis (Basic) - Particle Size Analysis using ImageJ software.
AMC-Tec | Video #001
ImageJ software
drive.google.com/file/d/1p4aw...
SEM Examples
drive.google.com/file/d/12suC...
Advanced Materials Research Laboratory
Department of Physics
University of Peradeniya
Sri Lanka - วิทยาศาสตร์และเทคโนโลยี


![[TH] 2024 PMSL SEA W1D4 | Summer | ละเอียดทุกเม็ด เพื่อเข้าไปเก็บคะแนน](http://i.ytimg.com/vi/W6i3u5r1Vbw/mqdefault.jpg)


I searched for hours finally found all in one. Thank you so much,
I'm really happy since this was helpful for you.
Nothing is more lucky to find this valuable video before rushing works at a due night :), respect.
Thank you... ☺️
Beautiful presentation with beautiful content...Thank you, Master... Thank you so much.....
Thank you so much for this! Because this was only video i have found who did by sri lankan university. Thank you for this. I'm also using ImageJ software for my research on quantification of microbeads.
Thank you very much for your kind words and soon I'll upload few more videos related to image processing. Feel free to put a comment if you have any questions related to these videos.
Best of luck with your research.
It was really helpful, thanks a lot
Good work sir and very helpful ...
Thank you so much for this video❤ Your explanation is too good to follow. It is very helpful for me...thank you!!
Thank you so much for your comment, and happy to hear it helps you.
Love it. Good video 😊
plz make a video for pore size determination
u explained really well thanks
nice
Great video. thanks
Dear Master,
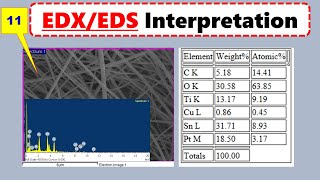
could you please make a video regarding the XRD peak analysis, EDS spectra analysis? If it understanding means I'll feel comfortable in characterisation. Kindly accept my request.
Thank you in an advance.
Sorry for the late reply. I'll try my best to make a video as soon as possible.
Wao Sir really superb. Bravo
Dear Master,
could you please make a video regarding the XRD peak analysis, EDS spectra analysis? If it understanding means I'll feel comfortable in characterisation. Kindly accept my request.
Thank you in an advance.
Sure. I'll make some videos. Until that if you have any doubts about XRD and EDS analysis, don't hesitate to mail me. (aaisurulakmal@gmail.com).
Thanks 🙏
Thanku somuch
Nicely
Thank you
Very informative session sir
Thank you...
Good work keep it up 😊
Thank you very much Shasika...
how to set the scale if there is no scale given in the image? when I captured the picture from a stereo microscope, there was no mention of the scale in the image, it would only show if I take a screenshot from the computer. What should I do now to set scale? the scale mentioned in the computer was 0.0787MM
For any measurements using ImageJ, you need a known scale or known length. Without that you can't measure any. In your case, if it's possible to get known distance by taking screenshot, you can go for that and do the measurement. For your publications, you can use the original one. I hope I got your question correctly.
Thank you for this nice video. how to measure, if there is no scale bar provided with the picture?
You must need to have any known distance in the image. As an example, if your sem image contains a micro-scale circuit and if you know the distance between two current paths, you can take that as a scale bar. If the image is the original one from the SEM machine (.TIF file format), you can use Gwyddion software without having a scale bar.
thanx
it is really healpful
Thank you...
Please can you tell me what is the benefit from doing SEM photos in general. And Especially related with environmental science, I mean what is the benefit for only SEM Photos , not SEM-EDX ?
Simply, SEM uses for the analysis of the morphology of nanostructures. EDX uses for the elemental analysis. The combined study will provide more details about nanostructure. For any field including environmental science, the technique you required will depend on the requirements. If your requirement is just only the morphology, SEM analysis is enough. But if you are looking for the morphology of a specific substance surrounded by different substances and if it is difficult to distinguish just by looking to the morphology, then you can go for the combined method.
After setting scale bar and and fig number in image, the scale disappearsin duplicate image every time. What to do?
Please check comments below. I have given an answer for this question earlier to another user. Feel free to reply if that doesn't helps you.
Thank you for the video. But I want to ask, once the scale bar had been customized, how do we measure our sample? Is it same like the first step?
Even though we have placed a new scale, dimension vice, it's the same. So it will not affect the measurements. You can do the same measurement using the customized scale anytime, as done in the first step.
@@amc-tec7721 Does as done in the first step mean we measure the customized scale bar first. Then, proceed to enter the known distance in the set scale with the value from the scale bar. After that, do measurement for the sample. Am i understand it correctly?
@@nurmaaeina2083 Yes. You are correct.
@@amc-tec7721 Alright, thank you Sir.
How to measure the velocity of a rising bubble in any solution using Image J?
ImageJ can be used to analyse images. So you have to get two images in a known time frame. In both two images, mark a reference point below the bubble (consider a fixpoint of the images such as a scratch of the solution container). Measure the distance between the bubble and the reference in two images and subtract them so you know the distance it travelled. Since you know the time it took, you can find the velocity.
Sir will you help me for some image processing, related to trichome (hair like structure on leaf) counting ? I am trying but not getting proper results.
Sure. What do you have to measure? If you want, contact me through the mail. (aaisurulakmal@gmail.com)
Dear Mahesh,
It's my pleasure to help with this regard. If you need to calculate trichome density, you have to select a known area and count the number of trichomes. In this case, it's better to select your lower magnification images so you can count higher numbers. It will reduce the standard deviation. For that, first, you have to set the scale as I described in the video. In the top left of the image, you can find the dimensions of the image. So you can find the area of the image. Once you count the number of trichomes, by dividing it by area, you can find the density of trichomes. If it is too difficult to count in a large area, you can crop the image and get a smaller area.
Since the trichomes are not linear, you can't measure the length with the straight line tool. In your case, you have to use segmented line tool. You can access it by right clicking on the straight line tool. In my video I have used two points to draw a straight line and in your case, you have to put several points to measure curved objects. When you put this points on Image, you can put the last point by right clicking. Finally you can measure the lengths as described in the video.
Good luck.
@@amc-tec7721 Thank you sir
is it necessary to measure size of all sem imges of same sample but in diff scale like ..200nm . 500 nm and in 2 micrometer ...
No need to do that. Only one size is enough. The lowest scale (higher magnification) will give you accurate results. Higher scales (lower magnification) will give you more particles to measure so that you can get large distribution. Better to select optimum magnification according to your requirement.
@@amc-tec7721 thank u Sir may i know where are u from ..
@@noreenramzan6727 You are welcome. I'm from the University of Peradeniya, Sri Lanka.
Sir, how we can label (arrow) the dimensions in ImageJ?
As far I know, there is no direct way as it is done with the software of SEM machines. But you can do it in three steps.
1) Measure the distance between two points you want.
2) Now draw an arrow between those two points using the arrow tool on the right side of the software. But it will be a single head arrow. To enable double head, go to Edit>Options>Arrow Tool. Then put a tick for the double head. Also, you can change the color. Once the arrow is okay, go to Edit>draw to draw that arrow on the image.
3) You can use the Text Tool to type your measured value and to draw that on your image go to Edit>draw.
If you have any problem, put a comment and I'll try my best.
Good luck.
I need zview, please help me
Sir,how do you get customized scale 200 nm??i did not get the meaning of customized scale?
Sorry for the late reply. It's not compulsory to put custom scales. But you can see in some journals, they have cropped the system generated scale and other SEM parameters (eg. electron energy) and inserted a custom scale. I have demonstrated it because some researchers may require it.
The customized scale we put in the SEM image do not appear in the image when the image is inserted in our presentation. Please help
After adding custom scale and other texts, try saving it in different file formats (JPG, PNG,...).
9:25, you can see the overlay is unchecked. This is important.
Hi Dr, if my sample is very thin 0.0823 micron...can it be seen under sem? And what is the suggestion for magnification? My material is polypyrrole..
Really sorry for the late reply. Normally I'll deposit CdS layer with particle size around 100 nm and they are clearly visible in SEM with 50kX magnification. So definitely you can see ~80 nm particles or ~80 nm thick layer of your sample by looking at the crosssection.
Which software is this??can you please say is SEM analysis process same for all samples?
This is ImageJ software and you can download it with the given link.
The procedure is quite similar for all samples. The only thing is the measurement depends on what you looking for. In here I'm measuring particles. Sometimes, you may have to measure nanowires, nanobelts, etc. Biological samples required different considerations. Anyhow, the final thing is you are measuring lengths, angles, or areas. That's common.
@@amc-tec7721 thank you very much sir
Is there any application that you use to view the sem image
To view, you can use any image viewer including windows image viewer. For the analysis purpose, I used ImageJ software.
thank u sir .. Then how to make more than one sem images in one frame ...
Open the sample image files you need to combine. Open a new blank image by File>New>Image. Give the height and width according to the number of images you are going to combine (sample image dimensions can be seen in the title bar). Select a sample image using the rectangular selection tool. Then copy and paste on the blank image in a suitable position. Repeat it for all sample images. That's it. There might be different ways available. I recommend you to use the word processing software which you use for the article writing so that you can change the image arrangement easily at any time. Good luck.
@@amc-tec7721 thank u so much for such guidance ...God bless u .love from Pakistan
Thanks a lot
You are welcome... :)
Earlier scale was 100 nm but u used 500 nm. Can we change the scale?
Of course, you can change the scale to any clearly visible value. Any journal accepts that.
why did you put 500nm at the picture when the bottom bar written 100nm?
The important thing is visibility. You may add several SEM images together in your manuscripts. In this case, you have to reduce the size of the images so they may not visible clearly. In this case, it's better to extend the scale a bit. This is a good practice for manuscript writing.
@@amc-tec7721 which means, the 500nm label is an example not the true size of the SEM image printed?
@@nurulnawwaraliaabintimahmo778 It is a true scale. Look carefully at what happened to the scale when I change the value to 500 nm. It relatively increases. I hope you understand the basic fundamentals of a scale. It's a relative one. Even though you change the scale to any value you like, the measurements taken using that scale must be the same. You can try different scales and measure a specific particle or grain or any object in the images. It should give you the same measurement. Feel free to ask if you have any doubt.
@@nurulnawwaraliaabintimahmo778 Also, it is not compulsory to put the exact scale printed in the original SEM image.
What application did you use
ImageJ
sir can u please help me I need this software
Please use this link to download the software. imagej.nih.gov/ij/download.html
finally, i found this
I'm really happy if this helpful for you.
I have a question please guide me
Sure. What is it?
What is binning?
Consider you have a distribution of data and you need to plot a histogram. Simply, partitioning the data in the distribution to the number of groups in an ascending or descending order can be named as binning and one of that groups is a bin.
where is software link. kindly send me plz
It's in the description. A google drive link...
how to download this software?
drive.google.com/file/d/1p4aweoils-CX85WbCNaMBEiXamRKPu54/view
GOOD PRESENTATION
Thank you sir.
software name plz?
It's ImageJ and it is open-source software.