Comparing intensities in different samples using ImageJ

ฝัง
- เผยแพร่เมื่อ 27 พ.ค. 2024
- For manual measurement:
1. Make sure your images were acquired using the same settings
2. Make sure there are no over/undersaturated pixels or histogram aberrations
3. Go to Anlayze / Set Measurement and select "Mean Intensity" and "Standard deviation" in the measurement settings
4. Pick any selection tool you want from the menu and select the region you want to measure
5. Go to Analyze / Measure
6. In the Results window make sure StDev does not render Mean Intensity values unreliable - วิทยาศาสตร์และเทคโนโลยี


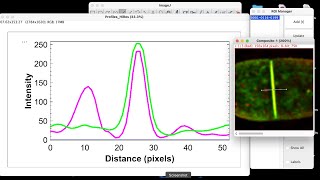


The channels needed to be separated before the measurements (or set to only measure in the green channel). For Integrated Intensity to be correct, the areas measured had to be the same. JPG compression may have altered the intensities in the images.
The first part of the video is great and the discussions of controls and numbers of images are excellent.
Hi i need your help. I am using imagej software to measure infrared images. I dont know how can i plot a graph between two variables like temperature vs concentration of any chemical.. can you help me please
Hello! This video was very helpful to me. Thank you
This is very easy. Histogram, set measurement, measure. Thank you!
I wish I could take credit for some things in life being easy... you are welcome anyways))
So would the first step before attempting to do anything be to convert the image to an 8bit image?
Hello thank you very much. I am analyzing the change of intensity of a blue image (the images are initially blue and gradually they become colorless). As a result the mean values increase as the images become transparent, why?. One may think that the mean value must decrease, mustn't it? I'd be very grateful if you answer me.
Hi Felipe,
this happens because you are measuring intensities: the whiter/brighter the spot - the higher the intensity.
If you would like to quantify how blue each image is, go to the top menu-> image->color-> split channels ->you 'll get three images containing intensities for red, green and blue-> click on the image called "your file name (blue)" -> go to the top menu-> Edit-> Invert (this will invert the intensities on your image)-> perform the measurement of the intensities. Now you should get high values in the "blue" images and low values on the transparent images.
best
Alyona
Hey Alyona, great video! I have a question... why does JPEG images only provide image dimensions in terms of rows and columns as compared to DICOM images which are given in mm?
hejsan, jpeg does not contain the metadata about magnification used during image acquisition, but you can manually set the scale in ImageJ. Here is a nice instruction video for it: th-cam.com/video/8_yuEemH7Qs/w-d-xo.html
Hey, thanks for your video. It was wonderful to learn so much about ImageJ. I just had a query, how to measure the velocity of a rising bubble in any solution using Image J?
this sounds like a long story) It depends on what your data looks like. I would ImageJ plugins like trackmate: imagej.net/plugins/trackmate/
@@AlyonaMinina Hey, Super thanks for the quick reply Alyona. I will go through the link you just shared. I want to track an air bubble coming out from the needle and rising up to the top in any liquid solution. If you want to suggest any more updates kindly put it in reply to this comment. Thanks a lot.
Hey Alyona! Thanks for the video! What to do with pictures which have pixels with intensity 0 and 255? You just mentioned - you don't want to see that... Can these pictures be used for analysis still? Do they need to be changed before? Thanks!
Dear Ulrika, Have you solve this question? I also have undesaturated pixels and not sure if I can apply this method. cheers.
Dear Ulrika, you can use the ImageJ threshold tool to create a mask that will exclude these values
@@AlyonaMinina HI Alyona, how does this masking work ?
we want to do it in two different sections of tissues and compare them .
So area need to be statistically same in both sections which is difficult to do in two different tissues. Please suggest.
I am not 100% sure I understood your question. if you are measuring mean intensity per area, then the areas can be of a different size. The only thing to look out for is to pick areas in different samples that correspond to the same biological function.
is there a way to change the intensity values in imagej? specifically for greyscale images.
you can do a bunch of modifications. what kind of change are you aiming for?
The random units at 3:40 are pixels and it´s simply the product of 1392x1040
Hi, do you know what the unit of the intensity in ImageJ is actually? Or does it have no unit?
Rabab Nezam these i don’t think there are any units to intensities in digital images. it will just intensity values ranging from 0 to 255 for an 8-bit image, for example
Hi Minina. Thank you for the nice video. I also wanted to ask: the "mean" in a histogram window refers to the averaged value of the 'R', 'G' , and 'B' values? If so (or not) why is it that histograms of the same-color picture but different ROI sizes read different values? I thought that the amount of red, for instance, in a picture should be the same regardless of picture size. Sorry for the length but kindly assist if you can. Thank you.
the "mean" in a histogram window refers to the averaged value of the 'R', 'G' , and 'B' values?
when the palette under the histogram chart is grey scale, the mean refers to the mean RGB intensity, you can see the intensity distribution for red, green and blue colors individually by clicking on the RGB button in the histrogram window once, twice or three times, respectively. When clicking on the RGB button you will see that the histogram palette turns red, blue or green.
why is it that histograms of the same-color picture but different ROI sizes read different values?
The mean value of intensity within a Region Of Interest will depend on what is selected within this region. For example, if ROI contains a dark part of the image, the mean value will also be low. By resizing the ROIs you include more or less pixels with low or high intensities, hence the mean values also vary.
thank you Minina.
What can you do if you have pixels from 0 to 184?
hmmm...did you obtain these values after thresholding?
if there are means that goes higher and higher, does it mean that the color intensity also goes higher?
Seth Chris Perkins sorry, means of what?
hi, if image intensity does not have a unit then how does one go about constructing a graph comparing control samples to test samples ? please help me.
there is no problem here, you can either call it arbitrary units or relative fluorescence units.
@@AlyonaMinina Thank you so much for your reply, is there any graphs you recommend for this kind of data? i am trying to show different expressions of a protein when exposed to aspirin and without.
@@hawzhinkhalis8335 a regular box plot with a t-test should do )
hai alyona, is okay if standar deviation is high?
i can't really answer this question in a simple way) It might be high due to the nature of your samples and then you will need high number of replicates to get a representative mean value
What is RGB value in image analysis?
it depends on the bit resolution of your image. For an 8-bit image you get values from 0 to 255 for each of the channels
what is her accent is it russian
Hello MInina. Could you please teach me on Zoom or WhatsApp. I am the beginner and want to learn how histogram can make