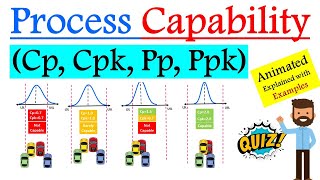
PROCESS CAPABILITY: Explaining Cp, Cpk, Pp, Ppk and HOW TO INTERPRET THOSE RESULTS

ฝัง
- เผยแพร่เมื่อ 20 พ.ค. 2024
- Process Capability is an important topic in continuous improvement and quality engineering and in this video, we discuss the basics of process capability, the major indices (Cp, Cpk, Pp, Ppk) and how to interpret those results!
0:50 - An Introduction to Process Capability - Comparing our process against our specifications
2:22 - The Cp Index - measuring the “potential” of your process
4:50 - The Cpk Index - A worked example and Explanation of the equation
6:40 - The Cpk Index - Centering up our process and re-calculating Cpk.
7:35 - The Pp index - Explaining the 2 different methods for calculating the standard deviation, and a discussion around process control
11:20 - The Ppk Index - Looking at the equation, and discussing the standard deviation (again)
11:55 - Interpreting the Results of your Capability Value - the sigma level, % Conforming, DPM (Defects Per Million) and Defect Rate (1 in 10,000??)
Standard Deviation Video: • How to Calculate Varia...
Control Charts Video: • CONTROL CHART BASICS a...
Free Black Belt Course:
cqeacademy.com/FreeBBCourse
Free Black Belt Resource:
cqeacademy.com/black-belt-cer...


I suspected that one of our processes was not in statistical control so I told my manager I wanted to collect data to measure Pp. I had to talk to human resources.
Why
😂
😂😂
After 8 months of LSS course work, this brought it all together into a very concise and easy way to keep Cp and Pp straight. Great video!
Brilliant, I value each moment I spent watching this luminous lecture.
Great stuff Andy. Really appreciated that you highlighted that a process needs to be in control for us to utilize the capability calculations. Count me in as a subscriber.
Awesome, thank you!!!
Wow! Your explanation of process capability is so clear and helpful that now I actually understand it. You have contributed amazing content and quality with this video, thank you!
Honestly, you are a perfect man. Thank you for everything.
Now, I understand these things. Previously, I memorized, but now I understand.
Thanks Nariman!
I passed the CQE exam by using most of your videos last week. Today, when I watch your video again, still I learn and still is great. Thank you ANDY
Wow thanks so for the amazing feedback Hiwa, I'm glad to be able to help you grow and learn!!!
Hi Hiwa
@@rajarajan9897 Hi
@@hiwajavanmiri7735 hi
@@hiwajavanmiri7735 need your Guidance for CQE Exam. Can you please Guide me.
I really like you presentation, it was easy to understand. Thanks!
Thank you Andy for posting this video! I am working on getting my ASQ Six Sigma Green Belt and this video helped make things a bit more clear. Can't wait to watch your other videos.
You're welcome David!
@@CQEAcademy eagerly waiting for more of these amazing videos from your side. 😊
I really appreciate it, Thank you very much for such an informative video. God bless you
excellent video. it really helped me understand the concept of my quality engineering lesson.
Amazing explanation!
Excellent presentation. Made me to understand without any difficulty, by simply following your lucid explanation. Thank You. My further request to you is need your similar video on calculating the defects per million (DPM) with any given Cpk values. I hope I made my requirement clear. Thanks in advance
Excellent !
Your videos are so helpful. I'm taking an Operations course that has no content like this to give context to the equations covered. Thank you!
Thanks so much!!!!!
Awesome!!.. Good explanation, great contents...Thank You!!
this video is very useful and perfect thanks
Really good video, good visuals, and well thought out. Thank you
Thanks!
Great video. Do you recommend a basic level book on cp, cpk, six sigma, for aerospace manufacturing process. Thanks
Hi and thanks for the video Cp, Cpk, Pp and Ppk are well understood now. Thanks so much
Thanks!!!
Another great Video, when doing capability analysis do you just relate to the drawing that highlights SC's to get your measurement points to do a cap study or do you look at other dimensions etc also.
Quality information & Awesome explanation 😊
Awesome Onkar, I'm glad you liked it!!!!
Your presentations are very good
Awesome video! Really helped out a lot! Hope you get a great weekend
Thanks Ludvig!
Such an excellent video!
Thanks Saheeda!!!
Thanks : D It helps me a lot!
Great video Andy. Two days ago, I spent over an hour learning Cpk on my own through self study. Had I watched this video first, I would have saved a lot of time. Do you cover statistical formulas this same way in your CSSGB prep course?
Thanks for the great content!
Great job! Thank you!
Thank you, and you're welcome Sanshray!
TQ, simple and easy to understand
Thanks so much!!!
Excellent content! Thank you.
Awesome, thanks Sandy!!
Absolutely great explanation...!!!
Thanks!
Your videos are awesome
Woooow!!! Amazing way to teach man!, you explained me in deep detail very important points no body explain, I Love You, thank you for your Job!
New Subscriber, Greetings from México!
You're absolutely welcome Oscar!
thank you sir for your time
You're welcome Marcus!!! I'm happy to help and serve!
Awesome, thanks!
You're welcome Mrunmayi!!!
Thanks for clear explanation and good examples.
You're welcome!!!
Great video, thanks for sharing
You're welcome Marcos!!!
Superb sir. I understand the concepts clearly it's really helpful for my gate preparation
Thanks!!!
Excellent !!!!
Glad you liked it!!!!!
-Andy
I watch this for preparing my interview of the role attribute verification engineer. Thank you sir
You're absolutely welcome Travis, glad to help!!
all lecture are very worthy
Thanks so much Khairul!
You are the man!
Thanks Emmanuel!!!
Great video. Really helpful for exam preparation. Congrats for this channel
Thanks Gustavo!
super job sir...you are great...i understood well...thank you very much...
Thanks Suresh!!!
Very,very good slides and explanation. Thank you
Thanks Francois!!!! I appreciate the awesome feedback!
Very Well explained. Upload more videos. Thank you.
Thanks, will do!
Awesome
Thank you!
Thank you', Sir
Very well explained
Thank you again
You're absolutely welcome!!! I'm so glad to help!
You are international man.
Thanks!!
Great info
Thanks!
you the best thank you so much
You're welcome!!!!!!!
I'm glad you like it!
Thank you Andy for the video, people in the factory is asking me when we have to use Ppk and when Cpk. Ciao, Gian Luca
Hey there! That's definitely a topic for a future video!
Your videos are awesome. I will be taking my CRE exam next Sunday. I chose the course Alpha Training and Consulting by John Lee. Both of your guys’ videos are awesome! Great refresher!
Thanks for the feedback Anthony!
Absolutely!
Hi Sir …I am new leaner it’s so much helping me your explanation of this knowledge better understand my new job …many thanks
You're absolutely welcome!!!!!
Glad to help!
One more nice video, Thanks a lot for sharing. I have one question, How do you calculated defects per million? is there any formula relates?
worthwhile video
Thanks!
you got a new sub! thanks for sharing!
You're welcome!!! I'm glad you liked the video.
-Andy
Thanks, i am trying to move up to a QE position at my company and ive been asked to do some capability work as a litmus test.
Oh awesome, that's a great opportunity!!!
Hey Andy - so as you mentioned at the end, different Cpks may be acceptable depending on the risk. My question is how do you establish what that acceptable limit is for different products / industries? I've been looking into various standards (medical device) with little luck as most text is left vague and open. Lets say a 1.00 Cpk is acceptable for a certain product when for another product its not and would need 1.33 Cpk? I know its based on risk but struggling to find anything to guide internal acceptance criteria. Thanks!
Hey Dylan!!!
I understand the struggle - I've also search for more definitive guidance in the past, and haven't found it.
You're right in that the general guidance is risk based, and again that's tough to create industry standard guidance once, because we all have different scales for the impact (severity) of our failure modes.
Some peoples worst failure mode would result in multiple deaths, while others might only impact the performance of the product without introducing any safety risk.
Think about your own organizations scales for severity and probability, and then think about the severity associated with the quality attribute that you're measuring. Then ask yourself, what probability of occurrence should we achieve, for that severity - and that should give you a decent target for Cpk.
The video show detail information. It's really interested. I hope that you could share more and more video in the next time.
By the way, Do you have documents relative lean six sigma topic ? Could you please share me?
Thanks so much for you sharing!
Glad you liked it!
Here's a link to a page with some content on lean six sigma:
www.cqeacademy.com/cqe-body-of-knowledge/continuous-improvement/lean-manufacturing/
Danke!
You're absolutely welcome!!!!
Thank you very much for this video, you have said it all.
I need some clarifications please,
1.we manufacture several batches per year on the same machine, and we are arranged with each batch to make a new adjustment, how I can control the performance of the machine, with what parameter Cp/CpK or Pp/Ppk? Knowing that the batches are manufactured in slightly different periods
2. we have parameters that are not at the upper or lower specification limit, how can we control the capability
Hey Rezgui!
Okay, so one of the baseline assumptions of control charts is that the process is consistent, and on-going.
If you only run a batch several times per year, then the typical control chart methodology doesn't apply. Because each and every unique setup is essentially "special cause variation", you're intentionally changing the process, so the old control limits don't apply.
There is a concept in SPC (Statistical process control) called short-run SPC, which is exactly what you're describing.
You may want to do a quick youtube search on short run SPC and see if that answers your question.
Check that out and see if that helps you out.
@@CQEAcademy thank you very much for your answer :)
@@rezguiimen5228 You're welcome!
where can i watch further about how to get the d2 in finding standard deviation in cpk?
hello, dear teacher, May I ask you a question ? In this video, you said before we calculate the CPK and PPK, we should make sure our process is under control, however, when we make a new product and set up new product lines, we do not know if our process is under control, so we would calculate the CPK and PPK, and judge our process is under control or not by the calculated CPK or PPK, is it right?
Thank you
You're welcome!
I can't find the video you mention at about 8:00 and don't see a link to it in the description.
Thanks!
You're welcome!!
Thanks so much!!!
Hi doc, can cpk test show muscle problems like strains?
thank you andy
Thanks Rizwan!!
It's v gud you have cleared my doubt ,I having that doubt for 5 years but I have one doubt about cp and its sigma value please explain it with example as u explained in pp sigma value...please sir....
Hey Kaddy!!!
Yes, that's probably the topic of a future video, i'll add that to the to-do list!
-Andy
Great straight to the point presentation, clearly explaining the differences... Thank you very much ! Enjoyed every minute of it.
Wow thanks so much, I appreciate that!!
Hello, thanks for the video , very clear and informative. My question for the last slide how are conformity % is calculated there?
Hey Ahmed! That conformity % comes from the normal probability tables.
The CPK calculation is very similar to the z-score transformation which will tell you the percentage of non-conforming material.
Check out this video to learn that process: th-cam.com/video/6hH7LwCw8qY/w-d-xo.html
Thanks for all your hard work putting these videos together! #alconcoworker
hahaha thanks!
thanks man!
You're welcome!!!
What I find a little bit confusing is that in the last section (where the sigma levels are explained) it looks like the output value remains the same but the specification limits change. (the red bars move outward in the graph) It is the opposite way around right?: the specification limits remain the same but the amount of output that fits within these limits changes. The more output fits within the limits, the higher your sigma number will be. Can you please confirm?
Hey There! You're correct most often the process is updated and the variation is reduced and the limits stay the same, and the width of the distribution shrinks.
15:32 Cpk에서 사용하는 군내표준편차와 Six Sigma에서 사용하는 전체 표준편차는 다릅니다. 따라서 Cpk와 시그마 수준은 비교를 하지 못 할 것 같습니다.
Hello, thanks for this video. but I have doubt regrading last chart in which you have shown Cpk and sigma level,DPMO and defect rate. As per my understanding DPMO of six sigma is 3.4 but you have mentioned it 0.002. Please clear my doubt.
thanks
Hey There!!
Okay, so I didn't get into this, because it would have added substantial length to the video, but the estimates for DPMO are the "short term estimates" of failures.
Six Sigma practitioners often apply a 1.5 sigma shift to estimate the long term capability and estimates of DPMO.
I've explained the 1.5 sigma shift over at CQE Academy:
www.cqeacademy.com/cqe-body-of-knowledge/continuous-improvement/continuous-improvement-techniques/
There's another video there, and I'd jump forward to 9:54 to hear the explanation
-Andy
@@CQEAcademy I 100% get what you are saying and referring to, but I do think for the sake of clarity that at least you should have mentioned this digress from 3,4 in this vid (which is great btw ;o) ), as this really trips many, I would assume..
@@CarstenDittrich2014 Thanks Carsten!
Yeah the next time I shoot a video on this topic I'll work in that topic.
Thank you so much. You should write a book on Lean Six Sigma, humanity needs it, period.
Wow thanks Souhaib!!
Actually, I did write a book (and I created a course) on Lean Six Sigma - that course (and book) is called the Green Belt Master Class, and I'm currently working on the Black Belt Master Class to build on that initial course (and book).
@@CQEAcademy Great, Will definitely look into those. I'm currently looking into what certifications are worth pursuing, but still in the process of acquiring the knowledge. I believe your course/book would probably get me intrigued 👍.
@@souhaibsebbane5623 Man I'd love to help you learn and grow your career - let me know if you ever have any questions about quality or continuous improvement (Green Belt, etc)
@@CQEAcademy Thanks a lot for your assistance, actually I'd like to know whether or not your program can prepare me for the Council for Six Sigma certification, because I am not qualified enough to take the ASQ (according to their requirements). Thanks again.
@@souhaibsebbane5623 Yes, my course would cover the body of knowledge for the CSSC lean six sigma green belt certification exam!
Hi Andy, thank you for the great video. If the Cp value is 0.69 and Pp is 0.52 is the process statistically control with cpk 0.55?
Hey Jeremy, it's very difficult, if not impossible to determine if your process is stable just using CP and PP values.
Generally, the closer your two numbers are (Cp and Pp) the more stable your process is, but you should really use a control chart to make that determination.
Hello Andy, I am trying to find out what is the minimum amount of the measured parts for evaluation Cpk and Ppk. I just remember from many years ago that there was specification how many parts have to be measured for evaluating short and long capability of the product. now I can not find. Thank you for your help.
Hey Lukas!!!
Okay, so there aren't any hard and fast rules for how many samples you must take to calculate process capability.
If you're taking data from a control chart, and converting that into Cpk, I'd recommend at least 25 sub-groups of data before you make any calculations.
Hi Andy!
I am following a six sigma foundations course on LinkedIn and noticed that the values of %Conforming and DPM's in the table at 14:22 don't match those as taught in six sigma. The course I'm following for example gives a %Conforming of 99.999 66% and DPMO of 3.4 at a sigma level of 6.
How come that they are different? Are they calculated differently?
Nevermind! I noticed you explained it in a reply on a comment from 1 year ago
Hey Bram!!!
Great question, okay so there is "short-term" capability, which is what I'm showing here in this slide.
Then there is "long-term" capability, where the estimates of the defect rates are "shifted" by 1.5 sigma.
That's where the difference comes from. That 1.5 sigma shift is "empirical", meaning that it is derived from experience
Hi, excellent video especially the interpretation of result of Cpk, but I wanna know: are Cpk numbers such as 1.67 and 2.00 are defined already in industry? Thanks for the answer
Hey Mark, what do you mean by being defined in industry?
As in, are those process capability numbers, and their associated statistics (DPM, Defect rate, % conforming) a pre-defined standard?
If so, yes, these rates are standard.
@@CQEAcademy Hi Sir, if these numbers are pre-defined standard in industry, where can I read the document saying Cpk 1.67 and 2.00 are already followed by manufacturers? Thank you for the answer
@@markjosephlobete2563 gotcha, I understand your question now.
Okay, so not all manufacturers have achieved a process capability of 1.67 or 2.00.
That depends on the process and the organization.
If you have a vendor or a company that you're thinking about, you can ask them what their process capability is.
If you're looking for a new vendor, you can also require certain levels of process capability as part of your supplier quality agreement.
-Andy
@@CQEAcademy hi Sir, thank you for your time and knowledge. More powers to you.
Actually industry standard is 1.33, at least that's what it was when I was a young Quality Engineer at Ford Motor Company while working with suppliers.
However, going from a 1.67 to 2.0 doesn't seem like much on a linear scale however, the quality level is astronomical and costly as Andy has stated it all depends on what your process is.
Typically your DFMEA, PFMEA, and Control Plan will identify Critical Characteristics that one needs to focus on, or control.
Good questions
Hi Andy great lectures... but is there a mistake here on your last slides 'interpreting CPk. Should the vertical lines be upper and lower CONTROL limits? the upper and lower spec limits are not related to the process as they are set by the customer, so they are constant as they are not related to the process standard deviation. Am I right here? Also - not fully clear on when you would want to use PPK rather than CPK. Be ver grateful if you can address these points, Andy - and many thanks :)
Andy.... on second thought - and i have thought this through now so maybe apologies for my knee-jerk comment. I am really trying to understand this.. So after further thinking here is what i understood and would like your 'OK' on it. The spec limits are indeed fixed by the customer , so it ay be +/- 3 mm or whatever - that is fixed. But what is NOT fixed is the 'distance ' between the mean of the characteristic and the USL or LSL in terms of process standard deviations. The desire is to have the process so on point that the variability is very low is the standard deviation to be very low. This would mean that the USL for exmaple may be 4 or 5 or 6 standard deviations away from the mean (depending on the criticality v cost tradeoff). This the USL itself does not move but the 'fatness' of the normal distribution ie the process capability is what moves. The control limits (UCL or LCL) are a reflection of the fatness and reflects the measure of the characteristic (eg product length) at 3 standard deviations from the mean. At this point we will have captured 99% of the area under the curve . The question then is the extent of the gap between this point and the USL - if this gap is a posive number then the process is in control as we are able to deliver the product within limits. If the USL is inside the UCL then, 'mission control, we have a problem'. Is this right?
Hi....How can I calculate the process capability for a specification unilateral, I mean, when the specifications is a min or Max value
Hey Joe!
Just do the calculation for the one specification that you have!
Hi sir, thanks for the great explanation. I only cant comprehend why the mean of 6 when centering the process in CPk becomes 8. Can you please highlighten me. Thank you very much.
Hey Michael, in this example, the LSL and USL are 2 and 14, meaning that the center (between those 2 spec limits) is 8 - basically I just took the average of 14 and 2 to find the "center" between those two spec limits.
Hi, thanks for the video.
I have questions:
1. If a car engine was designed to emit less than 4.6 g/min of NOx, and the agreed customer defect level is less than 3.4 defects per million engines. The legislation is changed to an emission target of 4.0 g/min. How can I find the USL and LSL?
2. 3.4 defects per million means 6 sigmas, isn't it?
Hey There!
So as it relates to emissions, there is no LSL, only an USL - which should be given to you either by the customer, or by legislation (4.0 g/min).
In terms of defects per million, there are two different estimates of defect rates.
Short term (which I've shown here) and Long-term (which I haven't shown).
the long-term estimates include the "1.5 sigma shift" and when you account for that emperical shift, yes, the 6sigma defect rates are 3.4 dpm.
@@CQEAcademy Appreciated the reply
Does the 1.5 sigma drift come into play on CPK?
Hey There!!
Okay, so I didn't get into the 1.5 sigma long-term shift, because it would have added substantial length to the video, but the estimates for DPMO are the "short term estimates" of failures.
I've explained the 1.5 sigma shift over at CQE Academy:
www.cqeacademy.com/cqe-body-of-knowledge/continuous-improvement/continuous-improvement-techniques/
There's another video there, and I'd jump forward to 9:54 to hear the explanation on the 1.5 sigma shift.
Hi Sir, Why do we correspond 0.33 Cpk value to 1 sigma and so on?
Hey Karthik, Remember that when we're calculating CPK, we divide the distance from the nearest spec limit by 3 sigma.
So if we were 1 sigma away from the nearest spec limit, our CPK would be 1/3 (0.333), hence 1 sigma is equal to a CPK of 1/3
Hi thanks for video. But i have doubt regarding to formula of standard deviation of Pp, why u use "n-1" not "n". Is not that Pp is indicate Population not sample?because we use "n" in calculate standard deviation population.. ?
Hey Tarsono, thanks for the question!
Okay so when we're calculating process capability, and that includes Pp, we're using sample data, which means when we calculating the standard deviation, we're calculating the sample standard deviation. This is why we use n-1 in the calculation.
what is the c4 factor? where does it come from and what does it mean?
Hey Jacob!!!
Great question, okay so this factor comes from control charts.
Remember Cpk calculations should originate from a control chart, and the c4 factor allows you to convert the average sample standard deviation (s-bar) from an X-bar and S chart into an estimate of the population standard deviation.
If our LSL is - what will do
👏🏽👏🏽👏🏽
Thanks David!
Hello, I think you should use ''control lmitits'' instead of ''spec limits'' in the SPC. Am I wrong?
@CQEAcademy Hello. I think I made a mistake. Spec limits are used in here to calculate the Cpk and some maths, control limits are used in control charts.
Great question - are you referring to a specific comment in the video?
In general, this topic is related to process capability, not SPC, so in this situation we would be focused primarily on the specification limit (Voice of the Customer), not the control limits (Voice of the Process).
-Andy
What's the d2 and c4 factors you're talking about? Could you elaborate a little more? 9:03
Hey Sreesh! These factors come to us from SPC (Statistical Process Control), and we use these factors to convert our SPC data (R-bar, S-bar) into an estimate of the population standard deviation.
th-cam.com/video/Aj7lJLR-7b4/w-d-xo.html
Hai there new sub here!
👍
is there a maximum value for cpl? (One sided specification
Hey Federico! No, there's no maximum value for a one-sided Cp calculation.
@@greenbeltacademy thank you
thanks , One question please : if a process values are cp 1.205 , cpk 1.198 , pp 0.881 , ppk 0.879 none of the process values are centered ?
Hey Juan!!
That's such a great question, okay so the way that you tell if your process is centered, is to compare your Cp against your Cpk.
If these two values are identical, then your process is perfectly centered.
So in this case, your cp value (1.205) is very close to your cpk (1.198), which implies that your process is very close to the center.
@@CQEAcademy Thanks a lot for your answer Andy, this question is part of the six sigma Black belt certification examn , and I answered wrong .... now Im sure of the right answer thanks to you.
@@eduardolorie You're absolutely welcome Juan!
Isn't six sigma related with 3.4 defects per million instead of 0.002?
Hi, what is the "underlying distribution" of a process?
Hey There!! Great question.
Okay, so the answer is, it depends on the process!
A major assumption in process capability is that the "underlying distribution" is the normal distribution (which is correct in many cases).
To test this assumption, you must collect data from your process and then plot this data with a Histogram to confirm what the underlying distribution is.
Hopefully that makes sense.
@@CQEAcademy Thanks. What should I reply when I am asked why it is unnecessary to know the underlying distribution?
Is it because we can see a clear special cause variation on certain number of samples occurring in the data, and therefore, there is no need to find out or plot the chart?
Hey @@snoringdragon1980 okay, so we've sort of switched topics from Cpk to SPC, which is definitely okay because those topics are definitely interrelated.
In process capability (Cpk) it is critical to understand the underlying distribution because the Cpk calculations are based on the normal distribution, and if your process is not normally distributed, your estimates of defect rates will be incorrect (invalid).
For SPC, when looking for special cause variation, the underlying distribution is irrelevant because control charts are based on the central limit theorem.
The CLT tells us that the distribution of sample means will be normally distributed even if the underlying distribution is not normally distributed.
I wanted to ask why do you use spec limits for the Cpk instead control limits in control charts?.... is it because process control is different than process capability in analyzing the data?.......
Hey There, okay so that's a great question!
Remember, the control limits from the control chart represent the "voice of the process", meaning that those control limits reflect the natural variation in the process (+/-3 sigma).
So if we compared our process variation against the process control limits, then our Cpk would always be 1, because the control limits are 3 sigma from the mean.
The specification limits come to us from the customer and represent the "voice of the customer", and we use these because that's how we compare our process against the customer requirements to quantify how much "non-conforming" or "out of specification" (OOS) material that our process will create.
I see ok got it... thanks for the reply
One more question.... the data that is analyzed for cpk should it be data that is a key characteristic of the product or should it be a process parameter of making the product which is best?
@@cocopop111 that's really up to you, and it depends on your product or process.
Generally though, i would recommend an attribute about your product, because that probably directly translates into a customer want/need.
Your process parameters - and I'm assuming here that you're talking some sort of process output - likely correlates with some CTQ (Critical to Quality) attribute, but not perfectly, so if you can measure a key characteristic of the product (a CTQ), then I'd start with that.
Ok great thanks for your responses !👍🏽👍🏽👍🏽