Log is taken when you want to make the equation a linear one. By doing this, you are creating a bias. This method removes the bias. Due to this, you can get an exact value of K and n.
9 batches ka disso graph plot kten ke liye fit data chahiye so 9 batches ka fit data alag alag calculate krke fir origin me graph plot kru kya sir ? Plz reply
@@meilabnitrourkela5314 Sir will you mail me the excel sheet for higuchi and peppas model please muje urgent h m pharma ke practical ke liye chahiye plz sir


Thank you.This would be very precise method to calculate the constants cor PK Model.
Millions of thnks for this awesome video i hv to fit my release data 🙏
This was awesome, thank you.
Thanks alot, very useful
this was very useful, thanks !
Thank you for the explanation
👌👌well explained
,Plz also explain the n values and their release pattern based on geometry.
Great job!
how to find the K and N, PLEASE?
Amazing explanation Thank you :)
Glad you liked it
Great, thanks
Thank you very much
Please, can you explain how can we fit to a Higuchi model? Thanks for your help!
Higuchi model is a limiting case of KP model when n=0.5.
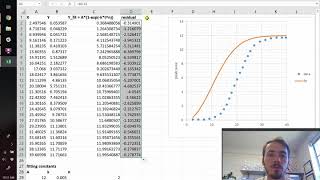
Sir, plot must be between log(release%) vs log (time)
Log is taken when you want to make the equation a linear one. By doing this, you are creating a bias. This method removes the bias. Due to this, you can get an exact value of K and n.
Higuchi fitting please! You are awesome
Good explanation
After closing the bracket in fit equation what to do next kindly guide me
Thanks brother!
Any time!
Could you elaborate on how to fix the cell am trying to Press F4 but it is failing
Click function key and F4
Thanks a lot!
You're welcome!
9 batches ka disso graph plot kten ke liye fit data chahiye so 9 batches ka fit data alag alag calculate krke fir origin me graph plot kru kya sir ? Plz reply
I don’t have that analysis and solver option in my excel what to do?
im wanna asking question
how we determine M(unlimited) from data?
please answer
M unlimited we assumed that drug is 100% released (loading dose)
How u put 0.5?
Sir there is no solver option in my excel
What is the formula which sir you type at 3.43 time.please write it in comment.
Why is that release calculation has to be done only 60% of the release, Sir?
This is the constrain of the mathematical model. All mathematical models are based on some assumption.
What is the name of this method of finding the constants?
Non-linear curve fitting method
Fit formula is not working ,i have typed same formula as you did but i am getting error in that case whats the issue?
May be solver not installed properly... Or your parameter estimation is not good...
It is a nice video. But I am facing a problem to understand when you put a equation at Fit cell. $H......
can you make a video on entrapment efficiency
Entrapment efficiency ko linear me kaise change krenge
What is the reason behind to find Square Difference(SD) ??
And Sir One more question Why we minimized the Error??? To find Actual K nd n value?
To minimize the model prediction data and the experimental data...
Thank u so much sir if i have 9 batches , to 9 batches ka korsmeyes peppas model kaise calculate kru sir
4.00
Im sorry sir, im not a well listener, what is CPDR once again ?? And how can we make the result of concentration to be CPDR ??
CPDR: Cumulative percent drug release
Numbers Populate nae ho rha 😢😢
Sir joh k ki value assume kr rhe woh hi value aa rhi first
It is not true for each cases. It depends on how close is your chosen approximate value of K
sir higuchi model bhi batado kese solve krna h
When n=0.5, the KP model becomes the Higuchi model. KP model is a generalized model.
@@meilabnitrourkela5314 but Sir n=0.5 to peppas model me bhi liya h
@@gauravpoint453 Higuchi model is a limiting case of KP model, where n is fixed to 0.5.
@@meilabnitrourkela5314 Sir will you mail me the excel sheet for higuchi and peppas model please muje urgent h m pharma ke practical ke liye chahiye plz sir
This is my email address dhimang122@gmail.com
Really can not undersatnd the content, first time to learn the kinetic model. 😇