This is the best video about Spectrophometer ever. I really learned alot. Thank you so much for the time you took to make it so simple. Kudos. Daniel from USA
I did some research and found that the incident light is not white light. It’s a certain color of light frequency split by a prism that is directed through the sample in a spectrophotometer. Then you can also measure each of the other light frequencies from the prism by directing them through the sample. This is what gives a unique set of readings that identifies the substance. This is why spectrophotometer are more expensive than colorimeter which uses a set of R,G,B filters. Wouldn’t this mean that Tommy’s device is really a colorimeter and not a spectrophotometer as he states in his subject title?
Big thankful of your video. I watched your video for my knowlodge. and this is the best video of spectrophotometers. but I think my brain diden't want to know all of this things lol..
this was really a fantastic video! quick question, for a lab I'm doing i need to measure coppersulphate concentrate at the beginning and end of my experiment. could i then use a calibration curve? also, what method/adaptions should i do if i add nitrogen fertlizer into the solution but only want to measure copper?
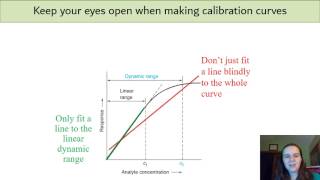
Hi there - glad you enjoyed the video. No - the two things are separate methods. Beers law describes a linear relationship between absorbance and concentration for molecules that absorb light *directly* - if you plotted the graph it would be a straight line. This works for molecules like chlorophyll and NADH which absorb light directly and are relatively unaffected by temperature/pH etc, hence you can mathematically predict the concentration with Beers law for these molecules. The calibration curve method is used for measuring molecules that *indirectly* absorb light eg via a chemical reaction. The classic example for the curve method would be using Bradfords reagent to measure protein concentration - the reaction between Bradfords and the protein causes the Bradfords reagent to change colour which you can measure on the spectrophotometer. This is a non-linear relationship that will depend on the temperature/pH/buffer, which is why you need to construct the calibration curve every time you want to make measurements. Hope that helps!
If your molecule absorbs light directly it will be a linear curve, if you measuring indirectly via an assay it will probably be curved. H2O2 absorbs directly in the UV range at 240, or you can measure indirectly via xylenol orange assay, which would need a standard curve making. Hope that helps!
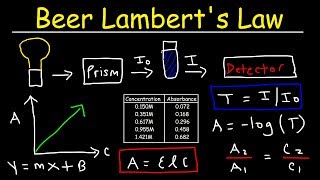
A bit confusing to use percentage to illustrate I0 and I, as it’d be an absolute quantity of irradiance rather than a fraction to anything. Would make more sense to illustrate the initial fraction via transmittance, then show absorbance as the anti logarithm to the base 10 of that.
No - wavelength uses the lambda symbol. Epsilon is a measure of how inherently absorbent a particular molecule is at a particular wavelength, so acts as a calibration constant
My assignment has asked me to calculate the concentration of several solutions using beer's law - we calculated their absorbance and I'm assuming L is 1cm - so by converting the equation C = A/EL - but it hasn't given us an epsilom symbol, @@katharinehubbard5043
I should have probably done this explanation the other way around. For molecules that absorb light directly (eg NADH, chlorophyll, DNA) the relationship will definitely be linear. However for some spectrophotometer assays that measure concentration indirectly there will be saturation. The obvious example here is a Bradford assay to measure protein - the Bradford reagent is only sensitive to low/medium protein concentrations, and saturates at high concentration. The relationship between protein concentration and absorbance is therefore non linear, so the standard curve method is used. Hope that makes things clearer!


Your videos save my entire university career!! Thank you for all you do,
Happy to help!
This is the best video about Spectrophometer ever. I really learned alot. Thank you so much for the time you took to make it so simple. Kudos. Daniel from USA
Wow! I can't really express in words how grateful to you. You save me. Thank you.
Thank god I found this video! Saved my life🥹
I did some research and found that the incident light is not white light. It’s a certain color of light frequency split by a prism that is directed through the sample in a spectrophotometer. Then you can also measure each of the other light frequencies from the prism by directing them through the sample. This is what gives a unique set of readings that identifies the substance. This is why spectrophotometer are more expensive than colorimeter which uses a set of R,G,B filters. Wouldn’t this mean that Tommy’s device is really a colorimeter and not a spectrophotometer as he states in his subject title?
Congratulations!!!! I really appreciated your video!
How is no one talking about her perfect arrows???
Great video btw
Big thankful of your video. I watched your video for my knowlodge. and this is the best video of spectrophotometers. but I think my brain diden't want to know all of this things lol..
Thank you.
Thank you so much
Love from pakistan.
Literally you helped me.
thank you !!
What is the extinction coefficient for amaranth red dye that has a max absorbance at 520nm?
great video. Would take 5 hour long lectures at school...
this was really a fantastic video! quick question, for a lab I'm doing i need to measure coppersulphate concentrate at the beginning and end of my experiment. could i then use a calibration curve? also, what method/adaptions should i do if i add nitrogen fertlizer into the solution but only want to measure copper?
Tnk u very much
Can you give a reference for the material you are covering? It will be really helpful for me to learn.
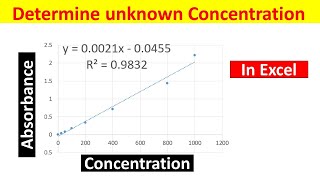
Thank you for this great video I want to ask about the concentration you calculate at the end is that we put in on the curve graph
Hi there - glad you enjoyed the video. No - the two things are separate methods. Beers law describes a linear relationship between absorbance and concentration for molecules that absorb light *directly* - if you plotted the graph it would be a straight line. This works for molecules like chlorophyll and NADH which absorb light directly and are relatively unaffected by temperature/pH etc, hence you can mathematically predict the concentration with Beers law for these molecules. The calibration curve method is used for measuring molecules that *indirectly* absorb light eg via a chemical reaction. The classic example for the curve method would be using Bradfords reagent to measure protein concentration - the reaction between Bradfords and the protein causes the Bradfords reagent to change colour which you can measure on the spectrophotometer. This is a non-linear relationship that will depend on the temperature/pH/buffer, which is why you need to construct the calibration curve every time you want to make measurements. Hope that helps!
@@katharinehubbard5043 Thank you for answering I got it ❤❤❤
I wonder how we know that our samples are indirectly resulted in abs or not. For example, does H2O2 create a linear or curved standard curve?
If your molecule absorbs light directly it will be a linear curve, if you measuring indirectly via an assay it will probably be curved. H2O2 absorbs directly in the UV range at 240, or you can measure indirectly via xylenol orange assay, which would need a standard curve making. Hope that helps!
Can i know the matters which can be measured by it and the matters can't
A bit confusing to use percentage to illustrate I0 and I, as it’d be an absolute quantity of irradiance rather than a fraction to anything. Would make more sense to illustrate the initial fraction via transmittance, then show absorbance as the anti logarithm to the base 10 of that.
Is epsilon the same as wavelength?
No - wavelength uses the lambda symbol. Epsilon is a measure of how inherently absorbent a particular molecule is at a particular wavelength, so acts as a calibration constant
My assignment has asked me to calculate the concentration of several solutions using beer's law - we calculated their absorbance and I'm assuming L is 1cm - so by converting the equation C = A/EL - but it hasn't given us an epsilom symbol, @@katharinehubbard5043
how could it be NONLINEAR?
IT IS LINEAR
I should have probably done this explanation the other way around. For molecules that absorb light directly (eg NADH, chlorophyll, DNA) the relationship will definitely be linear. However for some spectrophotometer assays that measure concentration indirectly there will be saturation. The obvious example here is a Bradford assay to measure protein - the Bradford reagent is only sensitive to low/medium protein concentrations, and saturates at high concentration. The relationship between protein concentration and absorbance is therefore non linear, so the standard curve method is used. Hope that makes things clearer!
@@katharinehubbard5043so if you're measuring protein by a dye-binding method, could the relationship be linear if solutions are very dilute?
الصووت حلوو
Your videos save my entire university career!! Thank you for all you do,