Out of all the statistics channels and videos, this by far is the most helpful; very simple and concise, didnt use any convoluted words to impress audience but precisely to help understand
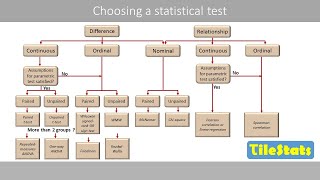
Dr Michael Moroney Thanks. I think it is also helpful in that it shows some of the relationships between the different types of tests in a way that a flow diagram doesn't.
Wow, you channel is amazing! Thank you for making something that I thought I will never understand so easy! Three hours of lecture from my professor vs 9 minute video from you.
Hi Anna Thanks for your endorsement. It may be that the three hour lecture gave you useful stuff, and the video helped organise it. Teaching statistics is very difficult, which makes learning it harder than it might need to be. Keep watching!
Thank you so much. This would have helped me not be so far behind in my introduction to Statistics course. I am going to pass this video to my former professor.
just 2 mins in the video and It has so much clarity!, it means a lot of efforts were put by you to summarize this. Thank you for making our lives easier.!
Very interesting presentation👏👏 I am having airborne dust concentrations data for >1 micron size, >3 micron, >5 micron and >10 micron size. (> means greater than) These data was taken before and during dust producing work in field study. N=5 How can i compare these before and during operations data ? It seems that there is relative percent variation in dust concentrations in atmosphere between before and during operation data. (Taking >1micron as 100 %) Before operation: The relative percent variation of concentration with different particle size is as below. For example Concentration of >1 micron size particle is 100%. >3 micron: 80% >5 micron : 60% >10 micron: 40%. During operation: Concentration of >1 micron size particle is 100%. >3 micron: 90% >5 micron : 80% >10 micron: 70%. It seems that >10 micron particle share is increased due to that machine operation...? Which test is suitable for analysing these type similar data for discussion ? How to use statistics? Any comparison among these concentrations of different particle sizes ? thank u.
Impressive. Your lock step approach makes it possible to analyze and conclude which test to use. I've been looking for this for a looooooong time. Thanks.
I love love love your Venn diagram approach!!! Thank you so much. I have read quite a few econometric textbooks and they still don't make it anywhere quite as clear as this. Thank you!
Hello there!! I watched the video "Statistical Tests: Choosing which statistical test to use". It very well explained all types of statistical tests and how to use by giving examples and elimination of tests based on Data, Samples and purpose. THANK you!!
As you can see from other questions, it is quite usual for the question to be vague. Only with experience do you work out what details are needed. It looks as if I need to do a video on non-parametric tests, which is what most of those are.
my bio stat teacher just read thro the power point in mono tone voice and didn't give introduction on any new hypothesis test we learned. i was struggling when reading text book (i am not good at learning from reading text book). ur video is very helpful and concise. it really helped me to understand the purpose of each test a lot better and make statistic more enjoyable. Thank you very much Dr Nic.
Seeing there were two independent samples, I would recommend difference of two means, independent samples. If the same people were measured before and after, then it would be paired difference of two means.
I don't know which one is correct in analyzing the difference between the pretest and posttest if the number of participants in my control group is 15 and control group is also 15, defying the criteria of using parametric test. What should I do? Please help♥️😭
Interval/ratio data is sometimes called numerical or measurement. You can see more about that in our video about types of data. There are several t-tests but they are for interval/ratio data. Test for difference two means and test for a mean are both t-tests. Spearmans Rho is used when you would normally do a correlation or regression, but your data is ordinal. I'm afraid you haven't given me enough information for me to be able to answer your question clearly.
the way u have editted ur videos is simply appreciable!!!! loved dat statement, " If you have any kind of self esteem!! Pause!! " hahahaha nyc 1 truly admirable
I've not finished the video yet, but it's been really helpful so far! Breaking it down into those questions has helped me figure out what I'm looking for.
So glad to hear it! Most text books etc use a flow diagram method, but I made up this way of displaying it as it shows the relationships between the methods as well.
I love how easy to understand and logical this was. The visual displays helped my understanding immensely. I wish all statistics teachers were this good at conveying information
That is great to hear. Usually textbooks use a flow chart approach, but I wanted to make one that held everything together so you can get an overview. It is my own invention, so I'm happy you find it helpful.
It's a chi squared test against a distribution. You found ten animals so if there was no difference you would have got 2 in desert, 4 in forest and 4 in city. In excel you set up one block with the numbers 3,7,0 and another block with 2, 4, 4. Then use chitest to find the p-value. The null hypothesis is that the distribution of found animals is the same as the distribution of the number of places. Hope this helps.
It is good to draw two boxplots and/or histograms as well, as that gives an indication of the spread of the two samples as well. Graphs are an essential part of any statistical analysis, and will have to be the subject of another video!
I found it really help full, I am attending my MPH but can really Understand my instructor in the class but after getting this video wow, I understand it thank you so much.
6 ปีที่แล้ว +12
thank you soon much :) it was very clear and systematic, helped a lot!
Thank you, your help me realised the importance of creativity and art students. A maths student think: DF = (s12/n1+s22/n2)2/{[(s12/n1)2/(n1-1)]+[(s22/n2)2/(n2-1)]} An Art student makes things fun and easy! Thank you. With gratitude.
Yes, unless the two groups are paired in some way. If it there is no way that the first group is matched to the second group, then it is independent samples. For example if you had identical twins and had one twin in the experimental group then it is not independent samples. But generally the scenario you describe is two samples.
Wow that Eureka moment!!!! I finally get it 😂😂😂😂 thank you so much!!! I can finish my dissertation in peace now! This is so simple and straightforward 👍
Helen is always angry when she asks people to answer her questions. She should change her attitude otherwise she can not find the real answers from the respondents and therefore, the results are not valid.
You wouldn't think she has an attidute if she was a man. Anything to bash a woman entrepreneur even if she's a cartoon. For a man, this behaviour would go un-noticed and, mostly, un-commented..
Guys, plz take it easy and don't consider my comment as sexist. I just try to explain that we should not force someone to answer our questions as it can effect they response. I apology if I offended someone. All the best.
@@xrc7445 Sure, make everything about gender again. No, the situation would not be judged differently if she was a man and no one is bashing female entrepreneurs. It's a cartoon made for education. Leave your stupid world views out of here.
@@DrNic Can I ask, I have a group of receivers that more than 300 observations, send them two types of email, to see whether the open rate is significantly different between two types of emails? which statistic test to use? open or not is a nominal data, but I have only one sample, I can not use the difference of two proportions, no?
@@chuminfeng5205 You do have two samples - the two types of email. So you can do difference of two proportions - or you can do the chi-sq test as you suggest. I have a video on the chi-sq test. th-cam.com/video/jhz0ubW0EWk/w-d-xo.html and then th-cam.com/video/qfxzG6FgVlM/w-d-xo.html
@@DrNic Definitely, it inspires me for the idea. I join your channel, and can I ask you to create more videos about A/B testing, or what is the difference between traditional statistical modeling and machine learning?
Partially helpful, but a bit confused about what the names of tests translate as - I think they're the same concepts as I've learnt in my lectures, but they don't have exactly the same names
Thanks. The thing is, if you use a computer package, it uses the applicable statistic and converts the answer to a p-value. I'll put that in my list of videos to make! Working on time series analysis and reporting at present.
Thank you so much for this! You didn’t just teach the content but also how to navigate and use what we learnt. Your videos have been exceptionally helpful. God bless you ❤
That is a really good question. It is green as the data is a measurement. (Except the group membership could count as a variable, but then that would also be the case for difference of two means independent samples.) One approach would be to say that it is a generalisation of the difference of two means, independent samples. Diff of two means can be done as ANOVA. It would be a good question to get students thinking about the relationship between the tests.
Your video was both simple and effective. It nicely presented the data, samples, and the purpose of analysis, helping in the selection of the appropriate statistical test. Thank you!
The test for normality depends on the test you are proposing to use. Most traditional statistical methods, such as comparing two means, or regression do not require the sample to have a normal distribution, particularly if the sample is big enough. They use of a parametric or non-parametric test depends on the type of data, rather than normality. For something like ANOVA, if you are not sure, do a Kruskal-Wallis as well. The results are seldom different, in my experience.
Well - you are looking at a relationship, so it is either chi sq or regression. Gender and adoption are both nominal variables, so that will be a chi sq test for independence. Awareness is probably a nominal variable so that will be chi - sq too. If you have age groups, then you will use chi sq. if you have actual ages, then you could do difference of two means, with the groups being adopted and not adopted.
this study done on air plan staff communication. observer used a valid scale 0-30 to observer communicate before implement a wireless head set and then after implement . the sample was random before implementation and another random sample used after implementation.
I beg to differ. it is comprehensible, it's just probably an accent you are not used to. oh and it's choco nutties by the way. There are many different accents so it wouldn't harm to learn to get used to some new one once in a while. Wouldn't it be boring if everyone spoke in the exact same way?
It depends on what you are measuring. You have told me the number of samples, but not the level of measurement or the purpose of the investigation. If you are comparing interval/ratio data it will be difference of two means. If you are comparing categorical data it will be difference of two proportions, which can be done as a chi-sq test.
Truly awesome vedio. If i have a teacher like you i am blessed. But still i feel now as i found you. Teaching is a great art. You have proven. I am curious to know about you.
We do ask teachers to become channel members to help us keep making videos. You would also get access to many more videos specific to channel members. th-cam.com/channels/G32MfGLit1pcqCRXyy9cAg.htmljoin
This is rather a complex question for this forum. When you say rank, do you mean put in order of rank, or do you give them a scale of, say, 1 to 5, to pick from? What do you mean by "more time off"? If you are dividing into groups you will need to be very specific. You also don't tell me how you measure performance.
This is a very good, easy-to-understand video. Thanks to you for creating and sharing this very powerful explanation and unexpectedly hilarious visuals.
Nice video. I am a newbie in stats. Hope I can find the answer to my queries here: 1) Where do the other tests like Mann Whitney U test, ANOVA, Kruskal Wallis fall? 2) When we want to calculate the difference of two means (independent samples), we calculate it by a two-sample t-test. What exactly are the 'tests for proportion', 'test for mean' and the test for 'difference of two proportions'?
I have a control group and two treatment groups. Within each respective group, I am interested in two variables, quality and quantity. How can I compare the groups with respect to these two variables?
Hi there. It sounds as if there are three groups in total - one control and two treatment groups. If the quality and quantity are both interval/ratio (also known as measurement) data, then you could use two separate one-way ANOVA tests - one for the quality and one for the quantity. If you wish to include both quality and quantity as well as group membership, then Generalised Linear Modelling could be helpful. ANOVA is like difference of two means, but for more than two groups. You can see my video here: th-cam.com/video/WcmzS3nEUqo/w-d-xo.html (It's my latest one, so good timing!)
@@Non-disjunction It may be that MANOVA is useful - it is similar to ANOVA, but with more than one predictor variable. My personal preference is to go for something simple like ANOVA unless it is really clear that you need a more complex method. Either way, it will help you to understand what ANOVA is doing. Happy to be of help!
The following data were obtained regarding quality of communication by using observation tool with valid scale 0-30. the meases taken befor and after implemnting a change score prior to implementation: Mean=19.60 Median=17 Standard deviation=3.54 following implementation: Mean=22.12 Median=23 Standard deviation=6.33 which statistical test shall I use to to analyse the data.
To answer your first question, it depends on what your observation is. If you are looking at just one quiz then each question is an observation, so the data is nominal if you are saying open or closed. However if you are looking at multiple tests, then for each observation or test you might have a percentage of open questions, which is ratio data. I need a clearer explanation of exactly what you are trying to find out before I can answer your other questions.


Out of all the statistics channels and videos, this by far is the most helpful; very simple and concise, didnt use any convoluted words to impress audience but precisely to help understand
Dr nic, in 2022, your videos are still extremely helpful. So clear and concise. Thank you for this gift.
Glad you like them! Who'd have thought they would still be going strong after ten years!
This is not only EXTREMELY helpful but hilarious! So fun to watch!
Hehehehe the notes she was leaving to make sure you pause the video are just hilarious.
Korni nyo
Thank you so much. This is a real life saver. Believe me. Among thousands of videos yours are straight to the point.
This is a useful video for students that are still at a point where they are unsure which of many statistical tests they should use.
Dr Michael Moroney Thanks. I think it is also helpful in that it shows some of the relationships between the different types of tests in a way that a flow diagram doesn't.
Wow, you channel is amazing! Thank you for making something that I thought I will never understand so easy! Three hours of lecture from my professor vs 9 minute video from you.
Hi Anna
Thanks for your endorsement. It may be that the three hour lecture gave you useful stuff, and the video helped organise it. Teaching statistics is very difficult, which makes learning it harder than it might need to be. Keep watching!
Thank you so much. This would have helped me not be so far behind in my introduction to Statistics course. I am going to pass this video to my former professor.
A bit depends on your sample size. You could use Spearman correlation or Kendall's tau.
just 2 mins in the video and It has so much clarity!, it means a lot of efforts were put by you to summarize this. Thank you for making our lives easier.!
Thanks - I really have put a lot of thought in, so it is nice to be appreciated.
Thank you. I did put a lot of thought into devising that diagram.
Very interesting presentation👏👏
I am having airborne dust concentrations data for >1 micron size, >3 micron, >5 micron and >10 micron size.
(> means greater than)
These data was taken before and during dust producing work in field study.
N=5
How can i compare these before and during operations data ?
It seems that there is relative percent variation in dust concentrations in atmosphere between before and during operation data. (Taking >1micron as 100 %)
Before operation:
The relative percent variation of concentration with different particle size is as below. For example
Concentration of >1 micron size particle is 100%.
>3 micron: 80%
>5 micron : 60%
>10 micron: 40%.
During operation:
Concentration of >1 micron size particle is 100%.
>3 micron: 90%
>5 micron : 80%
>10 micron: 70%.
It seems that >10 micron particle share is increased due to that machine operation...?
Which test is suitable for analysing these type similar data for discussion ?
How to use statistics?
Any comparison among these concentrations of different particle sizes ?
thank u.
Thank dr, you help a lot
Helpful Diagram 👏
Do u have any email id where u personally assist for PhD scholar? Kindly share if so
@@anikanashatmatin6860 Sorry - I don't have time for individual tuition/consultation at present.
Impressive. Your lock step approach makes it possible to analyze and conclude which test to use. I've been looking for this for a looooooong time. Thanks.
I love love love your Venn diagram approach!!! Thank you so much. I have read quite a few econometric textbooks and they still don't make it anywhere quite as clear as this. Thank you!
Hello there!! I watched the video "Statistical Tests: Choosing which statistical test to use". It very well explained all types of statistical tests and how to use by giving examples and elimination of tests based on Data, Samples and purpose. THANK you!!
As you can see from other questions, it is quite usual for the question to be vague. Only with experience do you work out what details are needed. It looks as if I need to do a video on non-parametric tests, which is what most of those are.
Your videos consistenly cuts through all the confusion one might have in statistics. Best teaching videos in stats hands down.
I'm happy to hear that.
Your videos, in my opinion, have some of the best explanations of basic statistics. Thank you.
As someone with no background in statistics trying to learn hypothesis testing, I found this video clear and concise. Thank you!
Glad it was helpful!
THANK YOU, MY GOD you saved me! Love Helen and her attitude haha! Thank you again :).
my bio stat teacher just read thro the power point in mono tone voice and didn't give introduction on any new hypothesis test we learned. i was struggling when reading text book (i am not good at learning from reading text book). ur video is very helpful and concise. it really helped me to understand the purpose of each test a lot better and make statistic more enjoyable. Thank you very much Dr Nic.
I'm studying for my comprehensive exam..and found this very useful..thanks. I don't mind the accent at all...
This is hands down the most useful graphic I've seen. Thank you, Dr. Nic
Wow, thanks! It took quite a bit of thinking to come up with it.
Seeing there were two independent samples, I would recommend difference of two means, independent samples. If the same people were measured before and after, then it would be paired difference of two means.
I don't know which one is correct in analyzing the difference between the pretest and posttest if the number of participants in my control group is 15 and control group is also 15, defying the criteria of using parametric test. What should I do? Please help♥️😭
Now we are in coronavirus year
Interval/ratio data is sometimes called numerical or measurement. You can see more about that in our video about types of data.
There are several t-tests but they are for interval/ratio data. Test for difference two means and test for a mean are both t-tests. Spearmans Rho is used when you would normally do a correlation or regression, but your data is ordinal.
I'm afraid you haven't given me enough information for me to be able to answer your question clearly.
the way u have editted ur videos is simply appreciable!!!!
loved dat statement, " If you have any kind of self esteem!! Pause!! " hahahaha nyc 1 truly admirable
I've not finished the video yet, but it's been really helpful so far! Breaking it down into those questions has helped me figure out what I'm looking for.
So glad to hear it! Most text books etc use a flow diagram method, but I made up this way of displaying it as it shows the relationships between the methods as well.
i cant believe how helpful this was
Thanks - I thought really hard about how to present this in a more holistic way than the usual flowchart approach, so I am happy it is helpful.
I love how easy to understand and logical this was.
The visual displays helped my understanding immensely.
I wish all statistics teachers were this good at conveying information
Thanks - I thought really hard about this to make it clear.
Most useful diagram i have found and its so simple. If i found this earlier I wouldn't have had such are hard time following along in class!!!!
That is great to hear. Usually textbooks use a flow chart approach, but I wanted to make one that held everything together so you can get an overview. It is my own invention, so I'm happy you find it helpful.
Various topics are now very easy to understand after listening ur lectures. Keep it up. You are spreading the wisdom
Good, informational video and thank you for including closed captions!
It's a chi squared test against a distribution. You found ten animals so if there was no difference you would have got 2 in desert, 4 in forest and 4 in city. In excel you set up one block with the numbers 3,7,0 and another block with 2, 4, 4. Then use chitest to find the p-value. The null hypothesis is that the distribution of found animals is the same as the distribution of the number of places. Hope this helps.
It is good to draw two boxplots and/or histograms as well, as that gives an indication of the spread of the two samples as well. Graphs are an essential part of any statistical analysis, and will have to be the subject of another video!
I found it really help full, I am attending my MPH but can really Understand my instructor in the class but after getting this video wow, I understand it thank you so much.
thank you soon much :) it was very clear and systematic, helped a lot!
We used to learn through animations. Excellent summarized presentation.
Helen bringing statistical queries as an example.
Nice one. Technology in action. I will continue to practice. Thanks.
Thank you, your help me realised the importance of creativity and art students.
A maths student think: DF = (s12/n1+s22/n2)2/{[(s12/n1)2/(n1-1)]+[(s22/n2)2/(n2-1)]}
An Art student makes things fun and easy! Thank you. With gratitude.
wow - i just understood my statistics module that happened in 2009 for the first time - thank you!
Yes, unless the two groups are paired in some way. If it there is no way that the first group is matched to the second group, then it is independent samples.
For example if you had identical twins and had one twin in the experimental group then it is not independent samples. But generally the scenario you describe is two samples.
"Pause if you have any kind of self-esteem" 😂
Not at present. We do have an iPhone/iPad app called "AtMyPace: Statistics" that will help with any statistics course.
Wow that Eureka moment!!!! I finally get it 😂😂😂😂 thank you so much!!! I can finish my dissertation in peace now! This is so simple and straightforward 👍
That is great news.
Best explanation I’ve seen yet! Solid gold! Thank you!!
Glad it was helpful!
Helen is always angry when she asks people to answer her questions. She should change her attitude otherwise she can not find the real answers from the respondents and therefore, the results are not valid.
You wouldn't think she has an attidute if she was a man. Anything to bash a woman entrepreneur even if she's a cartoon. For a man, this behaviour would go un-noticed and, mostly, un-commented..
Such a funny remark to teach about response bias.
Guys, plz take it easy and don't consider my comment as sexist. I just try to explain that we should not force someone to answer our questions as it can effect they response. I apology if I offended someone. All the best.
@@xrc7445 it's her choice
@@xrc7445 Sure, make everything about gender again. No, the situation would not be judged differently if she was a man and no one is bashing female entrepreneurs. It's a cartoon made for education. Leave your stupid world views out of here.
the best summary of the most frequently used statistic test, saving my time to reference my textbook!
Glad to hear it. I was pleased with how it turned out.
@@DrNic Can I ask, I have a group of receivers that more than 300 observations, send them two types of email, to see whether the open rate is significantly different between two types of emails? which statistic test to use? open or not is a nominal data, but I have only one sample, I can not use the difference of two proportions, no?
@@DrNic or should I use chi-sq test?
@@chuminfeng5205 You do have two samples - the two types of email. So you can do difference of two proportions - or you can do the chi-sq test as you suggest. I have a video on the chi-sq test. th-cam.com/video/jhz0ubW0EWk/w-d-xo.html and then th-cam.com/video/qfxzG6FgVlM/w-d-xo.html
@@DrNic Definitely, it inspires me for the idea. I join your channel, and can I ask you to create more videos about A/B testing, or what is the difference between traditional statistical modeling and machine learning?
all humans should watch this at some point in their lives
Brilliant video. Loved the sarcastic comments... it got me to pause. Great stuff Dr Nic
Glad you enjoyed it. The comments from my editor who is also my son. He's pretty funny
Partially helpful, but a bit confused about what the names of tests translate as - I think they're the same concepts as I've learnt in my lectures, but they don't have exactly the same names
Thanks. The thing is, if you use a computer package, it uses the applicable statistic and converts the answer to a p-value. I'll put that in my list of videos to make! Working on time series analysis and reporting at present.
One of the most useful vidios.. Thanks a lot
I have developed a lot of respect and love for statistics! thanks to you !!
That is lovely to hear, Radhika. Understanding statistics is such an important skill for being fully informed. Glad I could be of help.
@@DrNic thrilled to get a reply from you ma'am
Gem of a video!!
Thank you so much for this! You didn’t just teach the content but also how to navigate and use what we learnt. Your videos have been exceptionally helpful. God bless you ❤
So happy to hear that.
Well explained and fun. Thanks
That is a really good question. It is green as the data is a measurement. (Except the group membership could count as a variable, but then that would also be the case for difference of two means independent samples.)
One approach would be to say that it is a generalisation of the difference of two means, independent samples. Diff of two means can be done as ANOVA. It would be a good question to get students thinking about the relationship between the tests.
Pause if you care your education😂😂anyway good video. Thanks sm😆
Your video was both simple and effective. It nicely presented the data, samples, and the purpose of analysis, helping in the selection of the appropriate statistical test. Thank you!
Glad you enjoyed it!
From Bogotá-Colombia Thank you :-), this is a really good work, you inspire us as teachers-- :-)
The test for normality depends on the test you are proposing to use. Most traditional statistical methods, such as comparing two means, or regression do not require the sample to have a normal distribution, particularly if the sample is big enough. They use of a parametric or non-parametric test depends on the type of data, rather than normality. For something like ANOVA, if you are not sure, do a Kruskal-Wallis as well. The results are seldom different, in my experience.
Very helpful video. Helen's got an attitude though. Hilarious.
Thanks Abigail. She makes me laugh. My son, who was the editor for many of these videos, has a quirky sense of humour.
Two master's courses in & your video clearly explains what my text did not. Thank you!
Glad it helped!
Thank you.. very helpful :)
Well - you are looking at a relationship, so it is either chi sq or regression. Gender and adoption are both nominal variables, so that will be a chi sq test for independence. Awareness is probably a nominal variable so that will be chi - sq too. If you have age groups, then you will use chi sq. if you have actual ages, then you could do difference of two means, with the groups being adopted and not adopted.
I want some choconutties!!!!
Me too.
How good is this: Doing an online degree - without this type of resource would be totally lost. Thank you :)
You save my life, save my time. Loads of kisses to you :* :* :*
Diệu Trần hhhh
This is an excellent video to understand TYPES of test. Hats off!!
Thank you very much!
is that brienne from game of thrones?
this study done on air plan staff communication.
observer used a valid scale 0-30 to observer communicate before implement a wireless head set and then after implement .
the sample was random before implementation and another random sample used after implementation.
Lol, didnt even pause... haha.. *confused
I guess that means i'm doing regression analysis. Tons of help, here, Dr. Nic! God bless you!
Thank you for that. Good luck! I have a series about multiple regression that is also helpful for linear regression.
Your accent is totally non comprehensible. pickets? choco latte? tist?
^ spoken like a true aussie
New Zealand accent.
I beg to differ. it is comprehensible, it's just probably an accent you are not used to. oh and it's choco nutties by the way. There are many different accents so it wouldn't harm to learn to get used to some new one once in a while. Wouldn't it be boring if everyone spoke in the exact same way?
yo I blew on my screen because I thought your profile pic was a piece of hair hah got me
Thank you for explaining such complex concepts of choosing statistical test in easiest manner. Really helpful.
Glad it was useful. It took quite a lot of thinking to come up with that format
It depends on what you are measuring. You have told me the number of samples, but not the level of measurement or the purpose of the investigation. If you are comparing interval/ratio data it will be difference of two means. If you are comparing categorical data it will be difference of two proportions, which can be done as a chi-sq test.
Truly awesome vedio. If i have a teacher like you i am blessed. But still i feel now as i found you. Teaching is a great art. You have proven. I am curious to know about you.
Thanks. I put a lot of thought into that video. We are just about ready with a web version now too, in case they don't have an iPad or iPhone.
Thank you for such a great video! Really benefited from the content but also the methodical structure and system that you taught the concept through.
Glad you enjoyed it! I put a lot of work into the structure so it is good to be appreciated
Thank you for explaining with clarity about the various statistical tests.
You are welcome!
some of the best explanation among others. it's very helpful. thank you.
Thank you for a clear explanation. Please allow me to share this with my students.
Please do!
We do ask teachers to become channel members to help us keep making videos. You would also get access to many more videos specific to channel members. th-cam.com/channels/G32MfGLit1pcqCRXyy9cAg.htmljoin
This is rather a complex question for this forum. When you say rank, do you mean put in order of rank, or do you give them a scale of, say, 1 to 5, to pick from? What do you mean by "more time off"? If you are dividing into groups you will need to be very specific. You also don't tell me how you measure performance.
Best explanation yet! Thank you for posting this. Wow! I chose the correct one almost every time!
Thanks and well done. There is another practice video as well.
Wonderful idea for brainstorming... that she let us think first and then give answer.
I'm glad you like it. There is a follow-on video that gives you some more examples too. th-cam.com/video/PLTZrQt01S4/w-d-xo.html
Thank you for succinct and clear explanation. Such material are hard to come by.
I work hard to make it clear. So thanks!
This is a very good, easy-to-understand video. Kudos to you for creating it and thanks a heap for sharing it.
Glad it was helpful! I thought really hard about it and used it for teaching a university class.
This is a very good, easy-to-understand video. Thanks to you for creating and sharing this very powerful explanation and unexpectedly hilarious visuals.
Thanks - my son/editor has a warped sense of humour.
Nice video. I am a newbie in stats. Hope I can find the answer to my queries here:
1) Where do the other tests like Mann Whitney U test, ANOVA, Kruskal Wallis fall?
2) When we want to calculate the difference of two means (independent samples), we calculate it by a two-sample t-test. What exactly are the 'tests for proportion', 'test for mean' and the test for 'difference of two proportions'?
This is an insanely helpful video. The topic has been clearly explained and the examples are on spot. Thank you so much.
You're very welcome!
Excellent summarised presentation.
Wot excent?
Choosing statistical test is very important for every researcher. Thanks a lot.
Yes, you are right
Iam from india,I feel so glad to come accross this Dr Nice channel .all playlist are very useful 👍👍
Glad to hear that
@@DrNic mam it's great honour to me.that you replied.keep in touch with me mam.
I have a control group and two treatment groups. Within each respective group, I am interested in two variables, quality and quantity. How can I compare the groups with respect to these two variables?
Hi there. It sounds as if there are three groups in total - one control and two treatment groups. If the quality and quantity are both interval/ratio (also known as measurement) data, then you could use two separate one-way ANOVA tests - one for the quality and one for the quantity. If you wish to include both quality and quantity as well as group membership, then Generalised Linear Modelling could be helpful. ANOVA is like difference of two means, but for more than two groups. You can see my video here: th-cam.com/video/WcmzS3nEUqo/w-d-xo.html (It's my latest one, so good timing!)
@@DrNic Thank you so much for replying. I was struggling with MANOVA, I might as well follow your new video and apply it to my data. Thanks you!
@@Non-disjunction It may be that MANOVA is useful - it is similar to ANOVA, but with more than one predictor variable. My personal preference is to go for something simple like ANOVA unless it is really clear that you need a more complex method. Either way, it will help you to understand what ANOVA is doing. Happy to be of help!
The following data were obtained regarding quality of communication by using observation tool with valid scale 0-30. the meases taken befor and after implemnting a change
score prior to implementation:
Mean=19.60
Median=17
Standard deviation=3.54
following implementation:
Mean=22.12
Median=23
Standard deviation=6.33
which statistical test shall I use to to analyse the data.
I Love the art used in these videos. Very nice work!
Thanks - the artist is an anime fan, as I'm sure you have guessed.
Thank you. It would be wonderful if you provided your dataset to follow along with the Excel example.
I agree, but as the examples are all made up rather than real data, there is no data set.
A nice and innovative way to explain... Thank you so much.
Thank you very much, you have done a great job with simplifying what test to choose.
Thanks. I did a lot of thinking for this.
To answer your first question, it depends on what your observation is. If you are looking at just one quiz then each question is an observation, so the data is nominal if you are saying open or closed. However if you are looking at multiple tests, then for each observation or test you might have a percentage of open questions, which is ratio data. I need a clearer explanation of exactly what you are trying to find out before I can answer your other questions.
excellent video. anyone can clearly understand with such wonderful and creative explanation
Glad you think so!