One small caveat: in broader mathematics, "number of bacterial colonies" would be treated as a *discrete variable*, which means the variable is numeric but it's restricted to certain values (and between those allowable values are gaps that the variable can't take on). But if you're plugging that variable into a regression or t-test/ANOVA model, then you're treating it as continuous. To quote minitab, which has great articles on statistics: "If you have a discrete variable and you want to include it in a Regression or ANOVA model, you can decide whether to treat it as a continuous predictor (covariate) or categorical predictor (factor). If the discrete variable has many levels, then it may be best to treat it as a continuous variable. Treating a predictor as a continuous variable implies that a simple linear or polynomial function can adequately describe the relationship between the response and the predictor. When you treat a predictor as a categorical variable, a distinct response value is fit to each level of the variable without regard to the order of the predictor levels. Use this information, in addition to the purpose of your analysis to decide what is best for your situation." support.minitab.com/en-us/minitab-express/1/help-and-how-to/modeling-statistics/regression/supporting-topics/basics/what-are-categorical-discrete-and-continuous-variables/
@Raggul Kanakasabapathy, it sounds like it could go either way. I'm not an expert by any means, but I think you would decide whether to treat the independent variable as categorical vs continuous by asking questions like "do I expect a linear relationship between the input and output, such that more of the independent variable consistently leads to more/less of the dependent variable?" I think you can also ask questions like "for the purposes of my study, do I care about the *relationship* that the independent variable has to the dependent variable, or do I care about finding e.g. a single dose that is therapeutically significant?" Do you have reasons to expect that salt has a linear relationship (positive or negative) with plant growth? Are you interested in the specific nature of that linear relationship (e.g., is your goal is to say "for every 1 g of salt, the leaves grow X cm longer")? If so, then it might make more sense to treat mass as continuous. Alternatively, are you looking for whether a particular mass of salt exists which provides a statistically significant growth effect? Are there reasons why too little salt could inhibit growth, and too much salt could inhibit growth, but maybe there's a salt mass in the middle that could balance multiple biological factors and yield the most growth? If so, then it might make more sense to treat mass as categorical. The fact that you described 0 g of salt as the "control group" already suggests to me that you might be looking to compare salt vs. no salt, and the reason you have different amounts of salt is to help answer the question "do plants grow more effectively with salt than without salt?" In other words, having a control group suggests that you're not looking for the specific nature of a hypothesized linear relationship between amount of salt and amount of growth. I've never taught IB Bio, but I did teach IB Physics. If you're writing an IB Biology IA, I would think it's worthwhile to explain how you're analyzing your data and justify why you chose to treat the independent variable as categorical vs. continuous. If you choose to treat mass as categorical, then you've got a categorical independent variable and a continuous dependent variable--what test would you use in that circumstance? If you treat mass as numerical, then both the IV and DV are continuous--what test would you use in that circumstance? (By the way, you can still do a regression with a categorical independent variable, but that's not really done in IB Biology, and it sounds like this might not make sense in your case. Here's what it would entail. For each dose, you'd essentially have a different dummy variable that takes on a value of 0 or 1. So the variable m_1g would be 0 or 1, and the coefficient would tell you how much more/less growth the plant had compared to 0 g when 1 g of salt was added. The variable m_2g would similarly take on values of either 0 or 1, etc.) Another quick thing--if you go the route of performing multiple t tests (to compare each salt mass to the control group), then you want to watch out for family-wise error. You can do a quick Google search to see what this is. This is usually dealt with by lowering the p value that you need in order to reject the null hypothesis. For example, if you do 5 t-tests, and you'd normally use p < 0.05 as your significance level, then you might instead calculate 0.05/5 and use p < 0.01 as the significance level for each test, since performing multiple tests increases the likelihood of a false positive. There are different ways to account for this family-wise error, and the appropriate approach depends on the class you're in and how rigorous the statistics element is.
@Raggul Kanakasabapathy Since it's an IA, I can't quite give you a direct answer--that will be up to you. All I'll say is that it sounds like you're saying you have a continuous IV, a continuous DV, and you seek the mathematical relationship. if you go the route of regression, I have a few thoughts: (a) I think regression and mathematical relationships are less common in IB Bio IAs. Because of that, I recommend asking your teacher if you're on the right track and if you have a suitable topic, question, and statistical analysis approach. (b) If you go the route of regression, I think you will want to be careful about how you phrase your research question. If your understanding is that regression is appropriate when seeking a mathematical relationship between a continuous IV and a continuous DV, then you want to phrase your research question as seeking that *mathematical* relationship between the variables. (c) In all of it, the ultimate goal is to use the analysis as a mechanism to talk about in-depth Biology analysis. So if you find a negative linear relationship, then you want to use the Biology you've learned to try and explain, in depth, *why* that relationship exists. (d) Since I've never taught IB Bio, definitely have a conversation with your teacher about all of this. The advice I'm giving you is good for IB Physics, but I'm not sure how much of it translates over to Biology.
This is by far the best material about SPSS I've ever seen in my whole life. Throw 100$ SPSS books into trash can. This video is very beautiful in a minimalist way. Greetings from a procrastinator doctor, who is trying to hurry analysis at 07:00 AM for the finish date of a paper :-)
I have all this data I’ve collected for my masters thesis, I’ve been looking for a test to use for two days. This video, hands down, has just saved my life. THANK YOU!!!
Wow! I cannot express how much I am grateful to you for making this video. I spent one week figuring out which suitable statistical test was for my case. THANK YOU
Thank you so much for this video! Simple, concise, well organised -- it's rare to see such a well-made tutorial to a somewhat confusing topic such as this, amazing :)
After struggling for years trying to figure out about the necessity of so many statistical tests, finally I have an overview of statistical tools an how to choose one from.
I'm glad it helped! I often need the basics too. This is a good starting place, but this video really does make some simplifications, and as you study more, you'll see that things aren't always so clear cut. I'm glad it helped!
Thank you! Was recommended for Business Data Analytics. 4:08 is particularly useful if you're wondering what sort of test to use (or, what it's called!) Chi-Squared / t-Test / Correlation.
After struggling for years trying to figure out about the necessity of Sr many statistical tests, finally I have an overview of statistical tools an how to choose one from.
Yes. But the dependent variable should always be continuous variable. And if the independent variable is Nominal then use Phi coefficient test and if ordinal then use Spearman.
@Tessa Owens, it's a good point. Really, a lot of the dichotomies in this intro video disappear in higher-level stats. You can reproduce the same p-values in Anova as a regression model, and you can set up dummy/indicator variables to encode categorical variables. The main audience for this video is high schoolers who haven't learned any stats but are expected to use it in their IB Biology IA.
@@jincymathewm362 It's a good point. I've intentionally avoided ordinal data in this video because it really is a separate category from a stats perspective and usually requires nonparametric methods. Fortunately IB Bio high schoolers aren't expected to use it!
Thank you sooo much for this video! It saved my life!I spent so many days trying to understand which test I should use for my master's thesis. You explained VERY well and simple! Thank you again.
I'm homeschooled and we were tasked with an experimental quantitative research. It is my first research and I'm all by myself. Thank you so much for your simple explanation! You saved me big time. My teacher dosent teach and her modules are hard to understand. Now, I have an idea what statistical analysis I should use for my experiment. Many many thanks again🙏
@@danielm9463 My research is about aquaponics, how fish waste affects the growth of a plant, specifically Gotu Kola. My experiment will use two containers with different number of fishes to manipulate the amount of fish waste and both have one sample of Gotu Kola. Should I use correlation or t test? Thank you for you Ur reply :)
@@kenmakozume4781 This sounds really interesting. There might be a couple ways you could take it. Do you have a way to measure the mass/volume of fish waste, or is the plan to count the number of fish? I'm also curious how you're measuring plant growth--is this done on e.g. a daily basis or at the end of a fixed study period? One rule of thumb is that you need ~10 points minimum for correlation or simple linear regression, although you can often get away with fewer data points. ("Simple" linear regression just means there's a single dependent variable and a single independent variable.) So t-test might tend to be more natural for that reason, unless you're planning to collect repeated measures for each tank. If you do a t-test, you're treating your independent variable as categorical, almost as though you simply labeled one "high waste tank" and the other "low waste tank."
@@danielm9463 thank you for the kind compliment. I measure the fish waste amount by weighing scale(grams) and by counting the fish but the scale is more specific. I will be observing the samples for four weeks. Particularly, measuring the diameter and height of the largest and smallest Gotu Kola. Is that a t test??
@@kenmakozume4781 it sounds like you might have two different independent variables, and possibly two different dependent variables. You'll either have to pick one of each, or simply have a few different research questions, each of which you answer separately through a different statistical analysis (e.g., #1 does mass of fish waste impact diameter of..., #2 does mass of fish waste impact height of..., etc.). Are you measuring the samples periodically (e.g., at 0 weeks, 0.5 weeks, 1.0 weeks, 1.5 weeks, ... 4 weeks), or are you measuring just at the beginning and the end (i.e., at 0 weeks and at 4 weeks)?
Thank you so much, this is really helpful. I am even able to understand my own research thoroughly without thinking what was the reason why is it not relationship based.
Iam from india , teaching research to post graduate students of education department.feel very helpful to understand overall category /families of statistics test.very excellent content of video 👍👍👍👍
I'm glad it's helpful! If you're an MS or PhD student, it could be useful for big-picture frameworks. But just a word of caution--it does make some simplifications. I've gotten comments from grad school professors that the distinctions here are less valid at a more advanced level, and that this video ignores e.g. generalized linear models, which extend regression to categorical variables. Those things are all true, but they're too advanced for an introductory level. I made this video for high school students with no background in statistics who have the task of determining an appropriate statistical test to use for their research project.
Thank you for creating this useful video! I've actually been struggling with doing a statistical test for my Biology IA. If I'm looking at the effect of a chemical on germination duration of a seed, so relationship and continuous data, would you recommend doing a t-test or Anova for this as well, or is looking at pearson correlation and regression sufficient? Also, if the data is non-linear (it actually decreases up to a certain point at the optimum, then increases from there), which statistical test would be most beneficial?
It definitely sounds like your Y variable ("germination duration") is continuous, as you've said. But what would you say your X / independent variable is? Once you define it, would you say that it is continuous or discrete? I'm not sure correlation and regression will be available to you. Typically, if you're able to do a regression/ correlation analysis, then you *aren't* really able to do a t-test/ANOVA. A t-test/ANOVA implies that the independent variable is categorical, whereas regression/correlation implies that the independent variable is continuous.
@@danielm9463 i actually changed the concentration of the chemical, so it is continuous right? But even if I use regression/correlation, it would not be very clear because of the turning point in the middle, so what shall I do then?
@@tivishasaravanan6770 Ah, got it. You're absolutely right that both variables are continuous. It's a really interesting scenario you've got. Here are some ways to think about it. 1. This isn't really emphasized in an IB course, but it's incorrect to use linear regression and Pearson's correlation when the data don't have a linear relationship. Your IB Bio teacher (and the IB examiner) may not know that, however, and you could probably get away with calculating Pearson's correlation, and adding a caveat that the caution is needed because data fail to meet the condition of linearity. 2. One possible way to proceed (which I think you were referring to) is to "bin" your data. So, this means you break your concentrations into meaningful groups (e.g., 1-5 mg, 6-10 mg, etc.), and calculate the mean Y values for each categorical X value. Then you can do a t-test (if there are 2 groups) or ANOVA (if there are more than 2). This isn't really the best approach, but if you went this route, then ideally you'd have some sort of biology-based justification for the particular groupings you choose. (You want to at least attempt to answer the question, "why did you use 5-mg intervals instead of 10-mg intervals?"). IB would probably be impressed with this approach, but it's somewhat backwards, because you're treating your data as nominal and ignoring the fact that the 6-10 mg group represents *more* than the 1-5 mg group. Leaving information like this out of our statistical test lowers our ability to draw conclusive inferences. 3. So, instead of binning your data and *ignoring* the inherent ordering, a better approach (which uses the order) is Spearman's rank correlation coefficient. For your scenario, this is basically a non-parametric version of Pearson's correlation coefficient. Under this approach, you could either (1) use the exact concentrations (this would be easiest and probably best), or (2) bin the data into groups like described above (although doing this sacrifices some of the information in your data). If you go this route, it's worth reading a little about Spearman's rank correlation coefficient, but essentially it tests for a "monotone" relationship. This just means it tests for whether y is strictly increasing or strictly decreasing with x. Linearity is one type of monotonic relationship. (In addition to y = ax + b, y = ax^2 + bx + c is also monotone, etc.) 4. If the kink makes it look like there are two different *linear* trends, then you can always fit two linear functions (one for the first part of the data, and another for the second part of the data). This could lead to some rich analysis, because it allows you to talk about the threshold concentration, the changes in slope from one segment to the other, etc. Going this route, you could even report Pearson's correlation for each data subset. But it probably entails more analysis, and ultimately, IB wants you to be writing a Bio IA (not a Statistics IA). So it's about finding a balance. Fortunately, I don't think you have to go too in-depth on your stats calculations, which would mean you can do a lot of analysis, justify which test you used, and then jump straight to a discussion of how it relates to your research question & conclusion etc. without spending too much time explaining the calculation. (I think this is correct--you should double-check this with your teacher.) 5. If you have two distinct trends, but neither is linear, you can break your data into 2 subsets and use Spearman's rank correlation coefficient on each subset. Or, you could look for nonlinear trends within each subset. The easiest way to look for non-linear trends is guess-and-check. (e.g., try plotting y vs. x^2, y vs. 1/x, y vs. sqrt[x], etc. and see if any produce a straight line. If you find that y vs. x^2 is linear, then run a regression on y vs. x^2. Your regression line will have the form y = ax^2 +b, and the regression output will give you estimates of a and b.) The way to think about statistical tests is: (a) do the data satisfy the assumptions, and (b) if I treat the data differently (e.g. treat continuous data as though it's ordinal data as Spearman's correlation coefficient does), what information am I leaving out of my statistical test? Am I okay with leaving out that information? These are discussions you can have in your report. In general, the more information you leave out, the less powerful the statistical test becomes at finding a statistically significant effect. It's completely possible that you get a high p-value even when a true effect exists. That scenario arises when the test isn't powerful enough to detect the true effect, or the data have too much variance to detect the signal from the noise. But at the end of the day, what IB wants is for you to make decisions, justify them, and discuss the consequences. The more you can tie the statistical analysis back to your research question and your biology context, the better off you'll be.
Thanks a million, you've done excellent. How do I make use of regression analysis for this topic " The impact of smartphone overuse on student academic performance "
I would be glad to help! First, can you state what your independent variable (IV) and dependent variable (DV) are? When you respond, please make sure your IV and DV are numeric. For example, "smartphone overuse" isn't numeric because you can't say "smartphone overuse=3.5." However, instead of "smartphone overuse," there's something very similar that you could use instead, which *is* measurable / quantifiable with a number value. Another important question--how will you measure your variables and collect data?
I AM GLAD YOU RESPOND! AS FOR THE DV, I WILL GET THE RESPONDENTS CGPA FROM THE SCHOOL RECORDS, WHILE IV, I'LL USE LIKERT SCALE (SA, A, N,D,SD) AND THEN QUANTIFY EACH WITH NUMERIC CODE, WITH EACH CODE REPRESENTING (FOR INSTANCE;SA-1,A-2 etc). THEN DURING THE ANALYSIS, I'LL ASSIGN A QUALITATIVE MEANING TO EACH CODE eg '1- VERY EFFECTIVE', '2- EFFECTIVE' etc, WHICH WILL AFTER ANALYSIS RESULT IN IV REQUIRED FOR REGRESION. THIS IS ALL WHAT I'M THINKING. I AM NOT SURE IF IT WILL BE POSSIBLE AT ALL @@danielm9463
Why I am still looking at these as a graduated Master Student :D So these things, if we don't use very often, we human will soon forget it. That's why I come back and refresh my knowledge.
Cant correlation analyses deal with both continuous and categorical data? Cant we say that some categorical data have relationship to some continuousa data?
Absolutely. That sort of analysis doesn't happen in an IB Biology classroom, but in other contexts of applied statistics, what you describe is very common. It's possible for us to do a linear regression using categorical variables that we encode using 'dummy variables' that take on a value of 0 or 1. In multivariate contexts, we can even test for interactions between the variables by multiplying a categorical dummy variable by another independent variable that is continuous.
And in many contexts where we do a linear regression, we want to look at how well the model fits the data. So we looks at R^2 values, etc. to evaluate goodness of fit.
How about if our study is fnding the relationship of modular learning but it is categorical and 1 continuous which is the academic performance? Will we use correlation or T-test?
Check out the summary at 4:08 of the video. You have a categorical independent variable and a continuous dependent variable. You're comparing the categorical groups (the modular learning) on the basis of the continuous outcome (academic performance). Which do you think is more appropriate--t-test or correlation? When you get into higher-level stats, you'll learn that actually a t-test can be replicated in a regression model. But for now it's helpful to think about whether you're (a) testing if two groups are different on the basis of their continuous outcome variable (that's a t-test, or comparing groups) or (b) evaluating the strength of correlation / the quantitative effect of your predictor on the outcome (that's correlation/regression, or looking for a relationship).
In my research, there are two groups: control and experimental. Both of these groups gave pre- and post-tests. Which test should I use? In the experimental group, there are 100 people, and in the control group, there are 100 people.
If each person took a pre-test and a post-test, and assuming your outcome metric is numeric, then you could use a paired t-test where you compare the difference (post minus pre) among the two groups (control vs. treatment).
Thank you for making this tutorial! What if I want to see a relationship between stress and COVID-19 and I’m using both qualitative and quantitative data?
How will you measure stress? Are you asking individual people who had COVID whether they were stressed when ill? (Or maybe you're asking them about stress while ill with COVID and then again after they recover?) Or are you doing surveys to inquire about stress without collecting data on whether respondents have COVID, but then trying to correlate those stress values with COVID rates in your area?
Thank you for the clear explanation of the different statistical tests. Can you provide further information about two-way Anova? I am comparing 2 groups of students' (low proficiency and high proficiency) use of different reading strategies (6 different strategies). What statistics should I use to test the significance level? Thanks
Could you articulate your research question? That will impact how to approach the statistics. How are you measuring their proficiency? Is this a quantitative measure or a qualitative measure?
@@danielm9463 Thanks for your reply. I have 2 research questions. 1. What strategies do high-proficiency and low-proficiency EFL readers apply during a reading test? 2. What strategies do high-proficiency and low-proficiency EFL readers apply during the learning process to improve their reading skills? The categorical variables include the high-proficiency and the low-proficiency groups. The continuous variables are 6 strategies: cognitive, memory, compensation, metacognitive, affective and social. The responses for the strategy application were based on the 5-Likert scale. 2 responses regarding strategies uses were based on the multiple-choice questions. Thanks. Currently, I use the independent sample t-test. Should I use a different tests because I have more than 1 categorical variables and more than 1 continuous variables (responses for the 5-Likert scale). And for responses for the multiple choices, I used a z-score for two population proportion.
@@patnarinsupakorn1742 The first research question sounds like you would have this sort of data: High-proficiency: Cognitive Score = {3, 3, 5, 1, 2, 1, 5, 3, 4, 4} Memory Score = {2, 1, 2, 4, 2, 3, 1, 2, 2, 3} Compensation Score = {5, 4, 5, 4, 4, 5, 3, 4, 1, 5} Metacognitive Score = {3, 2, 4, 1, 5, 4, 5, 3, 4, 2} Affective Score = {4, 3, 4, 4, 5, 1, 4, 3, 4, 2} Social Score = {1, 1, 2, 1, 3, 1, 3, 3, 1, 1} and then the same sort of data for the low-proficiency students. The scores measure the extent to which each student used that strategy. Is that correct? In that scenario, you actually could have 3 different questions: (a) Which strategy is the high-proficiency group most using? (b) Which strategy is the low-proficiency group most using? (c) Do the most-used strategies among the high-proficiency group and low-proficiency group differ in a statistically meaningful way? And there may be something similar for your 2nd research question--it could potentially be much more than just a single research question. The challenge here is that you have two different possible independent variables (IV): you could focus on the particular strategy (e.g., cognitive, memory, etc.) and compare scores (a continuous variable) within a single group. Then you could duplicate that analysis for both groups. Or you could focus on the two groups (high-proficiency & low-proficiency) and do some sort of comparison between then (e.g., by comparing the most-used strategy in each group and ignoring the other strategies). If you want to compare the 6 strategies within the high-proficiency group or the low-proficiency group, and you're comparing continuous data for each, then you can't use a t-test. The t-test is only built for comparing two group, and it's inappropriate to apply a t-test multiple times (e.g., you don't want to do a t-test between cognitive and memory, then between cognitive and compensation, etc.--that greatly increases your chances of a false result). Instead, the way to go in that circumstance is usually ANOVA. Here's an article to help out: www.ncbi.nlm.nih.gov/pmc/articles/PMC3916511/
@@danielm9463 Oh, thank you so much for your detailef answers . I will check out the link. What I like to compare is whether the high proficiency and the low proficiency group use each strategy (among the six strategies) differently. Thanks once again for your help.
@@patnarinsupakorn1742 In that case, think of each strategy as a different experiment when picking a statistical test. For each strategy, you want to compare 2 categorical groups (high-proficiency vs. low-proficiency) to see if one group has a higher average Likert score. Which test from the video compares 2 categorical groups using a numerical dependent variable? It sounds like you would, in essence, repeat that test 6 times (once for each learning strategy).
One approach (though I'm not sure the extent to which this is done) is to proceed with individual t-tests that run through all possible pairwise comparisons. However, doing this introduces family-wise error. For example, if you do 10 follow-up pairwise t-tests using a significance level of 5%, then the cumulative chance of a false positive in any of the 10 tests is 1-(1-α)^10 = 40%. If the true Type 1 error rate is 40%, then it would be inappropriate to claim that our significance level is α = 5%. So the significance level must be adjusted to compensate for the family-wise error. One approach is the Bonferroni correction, which simply entails dividing the significance level α by the number of pairwise tests that are planned (or conducted post-hoc). If a cumulative Type 1 error rate of 5% is desired, then a significance level of 0.05/10 = 0.005 would be used. The more precise formula gives us the exact cumulative Type 1 error rate for 10 tests each using α = 0.5%. It is: 1-(1-.005)^10 = 4.9%.
It's a really good question. In this video, I'm using "relationship" to have a narrow meaning. It refers to relationship in the mathematical sense, which is the nature of the equation that relates the two variables. It's similar to how "correlation" has narrow meaning and only refers to *linear* correlation. The Chi squared test isn't about determining the specific nature of the mathematical equation relating the variables. If we stick to dichotomous variables (for simplicity), then the Chi squared test of independence is generally used when we have 1 sample, and we measure 2 categorical variables, and we want to know if they are independent or associated. (Just as a side note, "associated" is different from "correlated." Correlation is one specific type of association wherein the relationship is linear.) The Chi squared test of homogeneity is very similar. Generally, we can think of those problems as having 2 samples, where we measure the same categorical variable within each sample and we want to know if the two groups are the same or different. So neither Chi squared test assesses the specific mathematical nature of the relationship, which is why I'm not classifying it under the narrower mathematical definition of "relationship" in the video.
I am a med student at Orebro University Sweden, and yet this video was with no comparison far away better than the lecture we had at school, Gret work man, best of luck
Tack för dina vänliga ord! I'm really glad the video helped. It is a bit simplistic, but if you have any questions, don't hesitate to ask them in a comment!
hi daniel, thank for this clear discussion, what if i want to check the sub-variables. my IV study habits and it it has 6 subtopics under it. and i want to check of which of these sub variables are effective in the students Final grades? hope you get my point. thank you
What are your subtopics? My guess would be that they aren't subtopics, but just the "levels" or "values" that the IV takes on. It sounds like `study habits` would be categorical... I'm imagining the levels would be things like "uses note-taking," "uses flashcards," etc. What are your thoughts? If your IV is categorical and your DV is numerical, which test would you pick from the video?
@@danielm9463 The world needs an @danielm9463 full statistics course series. I’m taking a statistics for the social studies. I’ve watched tons of videos on TH-cam. I’ve not seen a tutorial done this well. So, we need more! You’ve got a gift ❤️
@@dharris6357 ❤❤❤ thank you!! I would love to make a full stats video series and hope to have time for that some day soon. What types of topics do you think would be most useful? Given that you study stats in your class already, is it the big-picture overview that is most useful, or would it be helpful to have videos on the mechanics of e.g. how to do a t-test and why/how it gets modified when there are unequal sample sizes, unequal variances, etc.? Or is it more helpful have videos with big-picture overview / how to look at different scenarios and see which test would apply?


One small caveat: in broader mathematics, "number of bacterial colonies" would be treated as a *discrete variable*, which means the variable is numeric but it's restricted to certain values (and between those allowable values are gaps that the variable can't take on). But if you're plugging that variable into a regression or t-test/ANOVA model, then you're treating it as continuous. To quote minitab, which has great articles on statistics:
"If you have a discrete variable and you want to include it in a Regression or ANOVA model, you can decide whether to treat it as a continuous predictor (covariate) or categorical predictor (factor). If the discrete variable has many levels, then it may be best to treat it as a continuous variable. Treating a predictor as a continuous variable implies that a simple linear or polynomial function can adequately describe the relationship between the response and the predictor. When you treat a predictor as a categorical variable, a distinct response value is fit to each level of the variable without regard to the order of the predictor levels. Use this information, in addition to the purpose of your analysis to decide what is best for your situation."
support.minitab.com/en-us/minitab-express/1/help-and-how-to/modeling-statistics/regression/supporting-topics/basics/what-are-categorical-discrete-and-continuous-variables/
thank you very much for your generous response.
Good
@Raggul Kanakasabapathy, it sounds like it could go either way. I'm not an expert by any means, but I think you would decide whether to treat the independent variable as categorical vs continuous by asking questions like "do I expect a linear relationship between the input and output, such that more of the independent variable consistently leads to more/less of the dependent variable?" I think you can also ask questions like "for the purposes of my study, do I care about the *relationship* that the independent variable has to the dependent variable, or do I care about finding e.g. a single dose that is therapeutically significant?"
Do you have reasons to expect that salt has a linear relationship (positive or negative) with plant growth? Are you interested in the specific nature of that linear relationship (e.g., is your goal is to say "for every 1 g of salt, the leaves grow X cm longer")? If so, then it might make more sense to treat mass as continuous.
Alternatively, are you looking for whether a particular mass of salt exists which provides a statistically significant growth effect? Are there reasons why too little salt could inhibit growth, and too much salt could inhibit growth, but maybe there's a salt mass in the middle that could balance multiple biological factors and yield the most growth? If so, then it might make more sense to treat mass as categorical. The fact that you described 0 g of salt as the "control group" already suggests to me that you might be looking to compare salt vs. no salt, and the reason you have different amounts of salt is to help answer the question "do plants grow more effectively with salt than without salt?" In other words, having a control group suggests that you're not looking for the specific nature of a hypothesized linear relationship between amount of salt and amount of growth.
I've never taught IB Bio, but I did teach IB Physics. If you're writing an IB Biology IA, I would think it's worthwhile to explain how you're analyzing your data and justify why you chose to treat the independent variable as categorical vs. continuous. If you choose to treat mass as categorical, then you've got a categorical independent variable and a continuous dependent variable--what test would you use in that circumstance? If you treat mass as numerical, then both the IV and DV are continuous--what test would you use in that circumstance?
(By the way, you can still do a regression with a categorical independent variable, but that's not really done in IB Biology, and it sounds like this might not make sense in your case. Here's what it would entail. For each dose, you'd essentially have a different dummy variable that takes on a value of 0 or 1. So the variable m_1g would be 0 or 1, and the coefficient would tell you how much more/less growth the plant had compared to 0 g when 1 g of salt was added. The variable m_2g would similarly take on values of either 0 or 1, etc.)
Another quick thing--if you go the route of performing multiple t tests (to compare each salt mass to the control group), then you want to watch out for family-wise error. You can do a quick Google search to see what this is. This is usually dealt with by lowering the p value that you need in order to reject the null hypothesis. For example, if you do 5 t-tests, and you'd normally use p < 0.05 as your significance level, then you might instead calculate 0.05/5 and use p < 0.01 as the significance level for each test, since performing multiple tests increases the likelihood of a false positive. There are different ways to account for this family-wise error, and the appropriate approach depends on the class you're in and how rigorous the statistics element is.
@Raggul Kanakasabapathy Since it's an IA, I can't quite give you a direct answer--that will be up to you. All I'll say is that it sounds like you're saying you have a continuous IV, a continuous DV, and you seek the mathematical relationship.
if you go the route of regression, I have a few thoughts: (a) I think regression and mathematical relationships are less common in IB Bio IAs. Because of that, I recommend asking your teacher if you're on the right track and if you have a suitable topic, question, and statistical analysis approach. (b) If you go the route of regression, I think you will want to be careful about how you phrase your research question. If your understanding is that regression is appropriate when seeking a mathematical relationship between a continuous IV and a continuous DV, then you want to phrase your research question as seeking that *mathematical* relationship between the variables. (c) In all of it, the ultimate goal is to use the analysis as a mechanism to talk about in-depth Biology analysis. So if you find a negative linear relationship, then you want to use the Biology you've learned to try and explain, in depth, *why* that relationship exists. (d) Since I've never taught IB Bio, definitely have a conversation with your teacher about all of this. The advice I'm giving you is good for IB Physics, but I'm not sure how much of it translates over to Biology.
@Raggul Kanakasabapathy Hi Raggul, I was curious how your IA turned out! Were you happy with the final product?
This is perhaps the most simpliest and yet full tutorial I've heard on statistical tests LOL.....Well put together Daniel. Thanks
Thanks for the kind message! I'm glad it was helpful
FACTS
Finally, the sky is clear....
This is by far the best material about SPSS I've ever seen in my whole life. Throw 100$ SPSS books into trash can. This video is very beautiful in a minimalist way. Greetings from a procrastinator doctor, who is trying to hurry analysis at 07:00 AM for the finish date of a paper :-)
I have all this data I’ve collected for my masters thesis, I’ve been looking for a test to use for two days. This video, hands down, has just saved my life. THANK YOU!!!
how did it go
Wow! I cannot express how much I am grateful to you for making this video. I spent one week figuring out which suitable statistical test was for my case. THANK YOU
Thank you so much for this video! Simple, concise, well organised -- it's rare to see such a well-made tutorial to a somewhat confusing topic such as this, amazing :)
9:57 minute video vs 6 weeks of lectures...just wow!
Man, this guy nailed it. I fumbled in my undergrad research. I wish this was available to me then. Thank you, Sir.
After struggling for years trying to figure out about the necessity of so many statistical tests, finally I have an overview of statistical tools an how to choose one from.
Im from the Linguistics field in this is still helpful for my thesis, thank you!
This video includes more data and has better educational content than what I learned in my MSc. Thank you Daniel.
Thanks to Allah.. I have found someone who is teaching the basics..I needed it badly
Hello. I need some help from you
@@asmasultana2732 yes
I'm glad it helped! I often need the basics too. This is a good starting place, but this video really does make some simplifications, and as you study more, you'll see that things aren't always so clear cut. I'm glad it helped!
Thank you! Was recommended for Business Data Analytics.
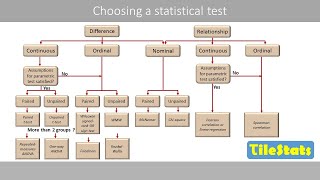
4:08 is particularly useful if you're wondering what sort of test to use (or, what it's called!) Chi-Squared / t-Test / Correlation.
I watched so many videos on this topic. But this is the best explanation so far. Thank you so much
An amazingly simple description of statistical tests. Thank you so much!
I fell in love with the way you explained both the qualitative and quantitative techniques.
Thanks Venu!
Statistics are so simple and easy to understand after your wonderful explanation. Thank you for this amazing video.
Stat is not easy subject 😭😒
After struggling for years trying to figure out about the necessity of Sr many statistical tests, finally I have an overview of statistical tools an how to choose one from.
This video has helped me more than my biology teacher, love you man
Glad it helped! I sympathize with IB Bio teachers! They're expected to teach statistics, but it's not part of the curriculum!
half semester of my statistics class didnt give such comprehension, thank you for this well put video.
For a broad perspective, this is a remarkable video. Nice work! This helps a lot
Thanks so much, Don!
Simple, easy and best and proper way to have quick notes
I like how the simplicity of your content, keep it up.
your english is impeccable. i can clearly hear the proper pronunciation and enunciation. Concept is well explained.
It's funny--I think people think I'm smarter than I am because I enunciate well :)
This video basically summarized two semesters of my statistics subject ngl.
Correlation can be used on categorical data too! Not just continuous data.
Yes, spearmans rank correlation
Yes. But the dependent variable should always be continuous variable. And if the independent variable is Nominal then use Phi coefficient test and if ordinal then use Spearman.
@@mrkhan.881 That's true for linear regression. Other regressions (e.g., logistic regression) do permit the dependent variable to be categorical.
@Tessa Owens, it's a good point. Really, a lot of the dichotomies in this intro video disappear in higher-level stats. You can reproduce the same p-values in Anova as a regression model, and you can set up dummy/indicator variables to encode categorical variables. The main audience for this video is high schoolers who haven't learned any stats but are expected to use it in their IB Biology IA.
@@jincymathewm362 It's a good point. I've intentionally avoided ordinal data in this video because it really is a separate category from a stats perspective and usually requires nonparametric methods. Fortunately IB Bio high schoolers aren't expected to use it!
You are so amazing! So simple yet eloquent!! you KNOW how to teach stats.
Thank you sooo much for this video! It saved my life!I spent so many days trying to understand which test I should use for my master's thesis. You explained VERY well and simple! Thank you again.
The Simplest and Most Comprehensive Demonstration of Tests...Thank You
Best video I watched in statistics especially in experimental designs
Thank you very much for that simple and valuable information
Very succinct and well put together. Thank you, Daniel!
I'm slow when it comes to math (like "if johnny has 5 apples" type slow) and this breakdown finally made things clear
Don't hesitate to post any questions you have about your work or what you're studying!
I am not clear about which technique is used for the which study before observing this video. Now I clear about it . Thank you sir
The way to generalize test in a table is amazing!! Thanks! It really really helps a lot!
Glad it helped! Just don't miss the correction I mentioned in the description
I wish you taught me Econometrics. Thank you for this.
The most simpliest and useful tutorial i ever heard and seen. Thank you soo much for giving us such a wonderful lessons. 😊😊😊
Thanks for making it super simple, clear, and easy to understand!
Simply the best and clearest explanation video.
This helped me a lot, and I'm taking a graduate level class. Thank you!
Thank you for this video. You did a great job of explaining the various statistical tests and their applicability.
best ever discussion in truly simple way. love from Bangladesh🇧🇩🇧🇩🇧🇩
I watched many videos on Hypothesis tests and always left with some sort of confusion. But you made it really simple. 🔥
From the bottom of my heart THANK YOU for this
Thanks for enlighten me on how to choose these statistical tests. I will be grateful to learn more.
tysm!! i would've had a breakdown if not for your video 🤧 also, the dun dun dun at 0:08 made me laugh so thanks for that too
This video is so well made! Thank you for your effort. It's really helping us out.
Very glad to hear that! Check out the caveats I pinned at the top of the comments. Feel free to ask questions!
Very brief and to the point. Great for a reasonable first overview of these topics. Thanks
I'm homeschooled and we were tasked with an experimental quantitative research. It is my first research and I'm all by myself. Thank you so much for your simple explanation! You saved me big time. My teacher dosent teach and her modules are hard to understand. Now, I have an idea what statistical analysis I should use for my experiment. Many many thanks again🙏
Feel free to post a comment if you have any specific questions about your research!
@@danielm9463 My research is about aquaponics, how fish waste affects the growth of a plant, specifically Gotu Kola. My experiment will use two containers with different number of fishes to manipulate the amount of fish waste and both have one sample of Gotu Kola. Should I use correlation or t test? Thank you for you Ur reply :)
@@kenmakozume4781 This sounds really interesting. There might be a couple ways you could take it. Do you have a way to measure the mass/volume of fish waste, or is the plan to count the number of fish? I'm also curious how you're measuring plant growth--is this done on e.g. a daily basis or at the end of a fixed study period?
One rule of thumb is that you need ~10 points minimum for correlation or simple linear regression, although you can often get away with fewer data points. ("Simple" linear regression just means there's a single dependent variable and a single independent variable.) So t-test might tend to be more natural for that reason, unless you're planning to collect repeated measures for each tank. If you do a t-test, you're treating your independent variable as categorical, almost as though you simply labeled one "high waste tank" and the other "low waste tank."
@@danielm9463 thank you for the kind compliment. I measure the fish waste amount by weighing scale(grams) and by counting the fish but the scale is more specific. I will be observing the samples for four weeks. Particularly, measuring the diameter and height of the largest and smallest Gotu Kola. Is that a t test??
@@kenmakozume4781 it sounds like you might have two different independent variables, and possibly two different dependent variables. You'll either have to pick one of each, or simply have a few different research questions, each of which you answer separately through a different statistical analysis (e.g., #1 does mass of fish waste impact diameter of..., #2 does mass of fish waste impact height of..., etc.).
Are you measuring the samples periodically (e.g., at 0 weeks, 0.5 weeks, 1.0 weeks, 1.5 weeks, ... 4 weeks), or are you measuring just at the beginning and the end (i.e., at 0 weeks and at 4 weeks)?
I don't know how you did it but you have helped me to know this better.
Bravo! It is just the thing I needed to refresh my background after a long break
I'm in IB Sports Exercise and Health Science but this video helped a lot for choosing the test for my IA. Thanks!
Haters will say this clip is way too simple, I will respond yes that’s why it’s almost perfect.
This video perfectly cleared everything up, thank you so much.
So helpful. Thank you! The basics make it easy to understand everything
Thank you so much, this is really helpful. I am even able to understand my own research thoroughly without thinking what was the reason why is it not relationship based.
Omg... I am a year 5 dental student and this vdo finally opened my mind...
Iam from india , teaching research to post graduate students of education department.feel very helpful to understand overall category /families of statistics test.very excellent content of video 👍👍👍👍
Thorugh and simple to understand. Thanks
Beautifully explained and simplified...... keep going 👍🏾
Awesome video! Thank you so much, Professor! Cheers from Brazil!
Great job! It helped a lot in explaining the basics! Nice work!
simply perfect and clear explanation . Thanks for your great effort
I also use chi square test for my accounting research bcz it has nominal and ordinal scale
Not just for biology subject
Comprehensive and over simplified.A great video.
Thanks man. Best explanation I've seen so far 👍
This video is golden for MS and PhD students
I'm glad it's helpful! If you're an MS or PhD student, it could be useful for big-picture frameworks. But just a word of caution--it does make some simplifications. I've gotten comments from grad school professors that the distinctions here are less valid at a more advanced level, and that this video ignores e.g. generalized linear models, which extend regression to categorical variables. Those things are all true, but they're too advanced for an introductory level. I made this video for high school students with no background in statistics who have the task of determining an appropriate statistical test to use for their research project.
Very clear explanation. Thank you so much.
Glad it helped!
JEEEZZ YOU JUST SAVED MY LIFE, best explanation video ever hands down and best 9 minutes of my life ! xx
Reaffirmed what I am beginning to grasp. Thank you!
Although the video is in English and my native language is Hindi, but I found it very much clear and informative.... thank you so much
Wow this simplified everything so much, thank you
Thank you for creating this useful video! I've actually been struggling with doing a statistical test for my Biology IA. If I'm looking at the effect of a chemical on germination duration of a seed, so relationship and continuous data, would you recommend doing a t-test or Anova for this as well, or is looking at pearson correlation and regression sufficient? Also, if the data is non-linear (it actually decreases up to a certain point at the optimum, then increases from there), which statistical test would be most beneficial?
It definitely sounds like your Y variable ("germination duration") is continuous, as you've said. But what would you say your X / independent variable is? Once you define it, would you say that it is continuous or discrete? I'm not sure correlation and regression will be available to you. Typically, if you're able to do a regression/ correlation analysis, then you *aren't* really able to do a t-test/ANOVA. A t-test/ANOVA implies that the independent variable is categorical, whereas regression/correlation implies that the independent variable is continuous.
@@danielm9463 i actually changed the concentration of the chemical, so it is continuous right? But even if I use regression/correlation, it would not be very clear because of the turning point in the middle, so what shall I do then?
@@tivishasaravanan6770 Ah, got it. You're absolutely right that both variables are continuous. It's a really interesting scenario you've got. Here are some ways to think about it.
1. This isn't really emphasized in an IB course, but it's incorrect to use linear regression and Pearson's correlation when the data don't have a linear relationship. Your IB Bio teacher (and the IB examiner) may not know that, however, and you could probably get away with calculating Pearson's correlation, and adding a caveat that the caution is needed because data fail to meet the condition of linearity.
2. One possible way to proceed (which I think you were referring to) is to "bin" your data. So, this means you break your concentrations into meaningful groups (e.g., 1-5 mg, 6-10 mg, etc.), and calculate the mean Y values for each categorical X value. Then you can do a t-test (if there are 2 groups) or ANOVA (if there are more than 2). This isn't really the best approach, but if you went this route, then ideally you'd have some sort of biology-based justification for the particular groupings you choose. (You want to at least attempt to answer the question, "why did you use 5-mg intervals instead of 10-mg intervals?"). IB would probably be impressed with this approach, but it's somewhat backwards, because you're treating your data as nominal and ignoring the fact that the 6-10 mg group represents *more* than the 1-5 mg group. Leaving information like this out of our statistical test lowers our ability to draw conclusive inferences.
3. So, instead of binning your data and *ignoring* the inherent ordering, a better approach (which uses the order) is Spearman's rank correlation coefficient. For your scenario, this is basically a non-parametric version of Pearson's correlation coefficient. Under this approach, you could either (1) use the exact concentrations (this would be easiest and probably best), or (2) bin the data into groups like described above (although doing this sacrifices some of the information in your data). If you go this route, it's worth reading a little about Spearman's rank correlation coefficient, but essentially it tests for a "monotone" relationship. This just means it tests for whether y is strictly increasing or strictly decreasing with x. Linearity is one type of monotonic relationship. (In addition to y = ax + b, y = ax^2 + bx + c is also monotone, etc.)
4. If the kink makes it look like there are two different *linear* trends, then you can always fit two linear functions (one for the first part of the data, and another for the second part of the data). This could lead to some rich analysis, because it allows you to talk about the threshold concentration, the changes in slope from one segment to the other, etc. Going this route, you could even report Pearson's correlation for each data subset. But it probably entails more analysis, and ultimately, IB wants you to be writing a Bio IA (not a Statistics IA). So it's about finding a balance. Fortunately, I don't think you have to go too in-depth on your stats calculations, which would mean you can do a lot of analysis, justify which test you used, and then jump straight to a discussion of how it relates to your research question & conclusion etc. without spending too much time explaining the calculation. (I think this is correct--you should double-check this with your teacher.)
5. If you have two distinct trends, but neither is linear, you can break your data into 2 subsets and use Spearman's rank correlation coefficient on each subset. Or, you could look for nonlinear trends within each subset. The easiest way to look for non-linear trends is guess-and-check. (e.g., try plotting y vs. x^2, y vs. 1/x, y vs. sqrt[x], etc. and see if any produce a straight line. If you find that y vs. x^2 is linear, then run a regression on y vs. x^2. Your regression line will have the form y = ax^2 +b, and the regression output will give you estimates of a and b.)
The way to think about statistical tests is: (a) do the data satisfy the assumptions, and (b) if I treat the data differently (e.g. treat continuous data as though it's ordinal data as Spearman's correlation coefficient does), what information am I leaving out of my statistical test? Am I okay with leaving out that information? These are discussions you can have in your report. In general, the more information you leave out, the less powerful the statistical test becomes at finding a statistically significant effect. It's completely possible that you get a high p-value even when a true effect exists. That scenario arises when the test isn't powerful enough to detect the true effect, or the data have too much variance to detect the signal from the noise.
But at the end of the day, what IB wants is for you to make decisions, justify them, and discuss the consequences. The more you can tie the statistical analysis back to your research question and your biology context, the better off you'll be.
@@danielm9463 I am impressed
Just starting to watch the video and loving your video
Sir you just nailed this video, you made me so damn clear about correlation. Thanks alot for your precious video😍
I'm so mad, how in the world I just found this tutorial when the semester is about to end 😢😢
Thanks a million, you've done excellent. How do I make use of regression analysis for this topic " The impact of smartphone overuse on student academic performance "
I would be glad to help! First, can you state what your independent variable (IV) and dependent variable (DV) are? When you respond, please make sure your IV and DV are numeric. For example, "smartphone overuse" isn't numeric because you can't say "smartphone overuse=3.5." However, instead of "smartphone overuse," there's something very similar that you could use instead, which *is* measurable / quantifiable with a number value. Another important question--how will you measure your variables and collect data?
I AM GLAD YOU RESPOND! AS FOR THE DV, I WILL GET THE RESPONDENTS CGPA FROM THE SCHOOL RECORDS, WHILE IV, I'LL USE LIKERT SCALE (SA, A, N,D,SD) AND THEN QUANTIFY EACH WITH NUMERIC CODE, WITH EACH CODE REPRESENTING (FOR INSTANCE;SA-1,A-2 etc). THEN DURING THE ANALYSIS, I'LL ASSIGN A QUALITATIVE MEANING TO EACH CODE eg '1- VERY EFFECTIVE', '2- EFFECTIVE' etc, WHICH WILL AFTER ANALYSIS RESULT IN IV REQUIRED FOR REGRESION. THIS IS ALL WHAT I'M THINKING. I AM NOT SURE IF IT WILL BE POSSIBLE AT ALL
@@danielm9463
Why I am still looking at these as a graduated Master Student :D So these things, if we don't use very often, we human will soon forget it. That's why I come back and refresh my knowledge.
I could not agree more!!
Thank you ain't enough for this. Rather, I have to say, love you.
Cant correlation analyses deal with both continuous and categorical data? Cant we say that some categorical data have relationship to some continuousa data?
Absolutely. That sort of analysis doesn't happen in an IB Biology classroom, but in other contexts of applied statistics, what you describe is very common. It's possible for us to do a linear regression using categorical variables that we encode using 'dummy variables' that take on a value of 0 or 1. In multivariate contexts, we can even test for interactions between the variables by multiplying a categorical dummy variable by another independent variable that is continuous.
And in many contexts where we do a linear regression, we want to look at how well the model fits the data. So we looks at R^2 values, etc. to evaluate goodness of fit.
How about if our study is fnding the relationship of modular learning but it is categorical and 1 continuous which is the academic performance? Will we use correlation or T-test?
Check out the summary at 4:08 of the video. You have a categorical independent variable and a continuous dependent variable. You're comparing the categorical groups (the modular learning) on the basis of the continuous outcome (academic performance). Which do you think is more appropriate--t-test or correlation?
When you get into higher-level stats, you'll learn that actually a t-test can be replicated in a regression model. But for now it's helpful to think about whether you're (a) testing if two groups are different on the basis of their continuous outcome variable (that's a t-test, or comparing groups) or (b) evaluating the strength of correlation / the quantitative effect of your predictor on the outcome (that's correlation/regression, or looking for a relationship).
One of the best explanations. Thanks much.
In my research, there are two groups: control and experimental. Both of these groups gave pre- and post-tests. Which test should I use? In the experimental group, there are 100 people, and in the control group, there are 100 people.
If each person took a pre-test and a post-test, and assuming your outcome metric is numeric, then you could use a paired t-test where you compare the difference (post minus pre) among the two groups (control vs. treatment).
@@danielm9463 thanku so much, If my population is larger, do I still need to use a paired t-test over a z-test?
Thank you for making this tutorial! What if I want to see a relationship between stress and COVID-19 and I’m using both qualitative and quantitative data?
How will you measure stress? Are you asking individual people who had COVID whether they were stressed when ill? (Or maybe you're asking them about stress while ill with COVID and then again after they recover?) Or are you doing surveys to inquire about stress without collecting data on whether respondents have COVID, but then trying to correlate those stress values with COVID rates in your area?
Great video, I understood the concept clearly.. thanks alot!
Thank you for the clear explanation of the different statistical tests. Can you provide further information about two-way Anova? I am comparing 2 groups of students' (low proficiency and high proficiency) use of different reading strategies (6 different strategies). What statistics should I use to test the significance level? Thanks
Could you articulate your research question? That will impact how to approach the statistics. How are you measuring their proficiency? Is this a quantitative measure or a qualitative measure?
@@danielm9463 Thanks for your reply. I have 2 research questions. 1. What strategies do high-proficiency and low-proficiency EFL readers apply during a reading test?
2. What strategies do high-proficiency and low-proficiency EFL readers apply during the learning process to improve their reading skills?
The categorical variables include the high-proficiency and the low-proficiency groups. The continuous variables are 6 strategies: cognitive, memory, compensation, metacognitive, affective and social. The responses for the strategy application were based on the 5-Likert scale. 2 responses regarding strategies uses were based on the multiple-choice questions. Thanks. Currently, I use the independent sample t-test. Should I use a different tests because I have more than 1 categorical variables and more than 1 continuous variables (responses for the 5-Likert scale). And for responses for the multiple choices, I used a z-score for two population proportion.
@@patnarinsupakorn1742 The first research question sounds like you would have this sort of data:
High-proficiency:
Cognitive Score = {3, 3, 5, 1, 2, 1, 5, 3, 4, 4}
Memory Score = {2, 1, 2, 4, 2, 3, 1, 2, 2, 3}
Compensation Score = {5, 4, 5, 4, 4, 5, 3, 4, 1, 5}
Metacognitive Score = {3, 2, 4, 1, 5, 4, 5, 3, 4, 2}
Affective Score = {4, 3, 4, 4, 5, 1, 4, 3, 4, 2}
Social Score = {1, 1, 2, 1, 3, 1, 3, 3, 1, 1}
and then the same sort of data for the low-proficiency students. The scores measure the extent to which each student used that strategy. Is that correct? In that scenario, you actually could have 3 different questions:
(a) Which strategy is the high-proficiency group most using?
(b) Which strategy is the low-proficiency group most using?
(c) Do the most-used strategies among the high-proficiency group and low-proficiency group differ in a statistically meaningful way?
And there may be something similar for your 2nd research question--it could potentially be much more than just a single research question.
The challenge here is that you have two different possible independent variables (IV): you could focus on the particular strategy (e.g., cognitive, memory, etc.) and compare scores (a continuous variable) within a single group. Then you could duplicate that analysis for both groups. Or you could focus on the two groups (high-proficiency & low-proficiency) and do some sort of comparison between then (e.g., by comparing the most-used strategy in each group and ignoring the other strategies).
If you want to compare the 6 strategies within the high-proficiency group or the low-proficiency group, and you're comparing continuous data for each, then you can't use a t-test. The t-test is only built for comparing two group, and it's inappropriate to apply a t-test multiple times (e.g., you don't want to do a t-test between cognitive and memory, then between cognitive and compensation, etc.--that greatly increases your chances of a false result). Instead, the way to go in that circumstance is usually ANOVA. Here's an article to help out:
www.ncbi.nlm.nih.gov/pmc/articles/PMC3916511/
@@danielm9463 Oh, thank you so much for your detailef answers . I will check out the link. What I like to compare is whether the high proficiency and the low proficiency group use each strategy (among the six strategies) differently. Thanks once again for your help.
@@patnarinsupakorn1742 In that case, think of each strategy as a different experiment when picking a statistical test. For each strategy, you want to compare 2 categorical groups (high-proficiency vs. low-proficiency) to see if one group has a higher average Likert score. Which test from the video compares 2 categorical groups using a numerical dependent variable? It sounds like you would, in essence, repeat that test 6 times (once for each learning strategy).
Beautifully explained Daniel. Thank you
How do you proceed from one-way ANOVA? How do you figure out how many and which one is statistically significant?
One approach (though I'm not sure the extent to which this is done) is to proceed with individual t-tests that run through all possible pairwise comparisons. However, doing this introduces family-wise error. For example, if you do 10 follow-up pairwise t-tests using a significance level of 5%, then the cumulative chance of a false positive in any of the 10 tests is 1-(1-α)^10 = 40%. If the true Type 1 error rate is 40%, then it would be inappropriate to claim that our significance level is α = 5%. So the significance level must be adjusted to compensate for the family-wise error. One approach is the Bonferroni correction, which simply entails dividing the significance level α by the number of pairwise tests that are planned (or conducted post-hoc). If a cumulative Type 1 error rate of 5% is desired, then a significance level of 0.05/10 = 0.005 would be used. The more precise formula gives us the exact cumulative Type 1 error rate for 10 tests each using α = 0.5%. It is: 1-(1-.005)^10 = 4.9%.
thank you!! i need to use this info in my bio enzyme productivity analysis thesis!
Is Chi Square not used when you want to find a relationship between two or more variables? I'm a bit confused now.
It's a really good question. In this video, I'm using "relationship" to have a narrow meaning. It refers to relationship in the mathematical sense, which is the nature of the equation that relates the two variables. It's similar to how "correlation" has narrow meaning and only refers to *linear* correlation.
The Chi squared test isn't about determining the specific nature of the mathematical equation relating the variables. If we stick to dichotomous variables (for simplicity), then the Chi squared test of independence is generally used when we have 1 sample, and we measure 2 categorical variables, and we want to know if they are independent or associated. (Just as a side note, "associated" is different from "correlated." Correlation is one specific type of association wherein the relationship is linear.)
The Chi squared test of homogeneity is very similar. Generally, we can think of those problems as having 2 samples, where we measure the same categorical variable within each sample and we want to know if the two groups are the same or different. So neither Chi squared test assesses the specific mathematical nature of the relationship, which is why I'm not classifying it under the narrower mathematical definition of "relationship" in the video.
Thanks for the explanation. 👍 Appreciate your efforts.
I am a med student at Orebro University Sweden, and yet this video was with no comparison far away better than the lecture we had at school, Gret work man, best of luck
Tack för dina vänliga ord! I'm really glad the video helped. It is a bit simplistic, but if you have any questions, don't hesitate to ask them in a comment!
Best video on statistical tests
Thank u sir u made it so simple to understand excellent presentation with explaination. Thank u too much
Best ever teaching technique....
THANK U SO MUCH HUHUHU I HOPE I PASS MY TEST NEXT WEEK❤❤
hi daniel, thank for this clear discussion,
what if i want to check the sub-variables. my IV study habits and it it has 6 subtopics under it. and i want to check of which of these sub variables are effective in the students Final grades? hope you get my point. thank you
What are your subtopics? My guess would be that they aren't subtopics, but just the "levels" or "values" that the IV takes on. It sounds like `study habits` would be categorical... I'm imagining the levels would be things like "uses note-taking," "uses flashcards," etc. What are your thoughts? If your IV is categorical and your DV is numerical, which test would you pick from the video?
Thank you very much for the simplest explanation
Best summary video ever!!
Thank you!!
@@danielm9463 The world needs an @danielm9463 full statistics course series. I’m taking a statistics for the social studies. I’ve watched tons of videos on TH-cam. I’ve not seen a tutorial done this well. So, we need more! You’ve got a gift ❤️
@@dharris6357 ❤❤❤ thank you!! I would love to make a full stats video series and hope to have time for that some day soon. What types of topics do you think would be most useful? Given that you study stats in your class already, is it the big-picture overview that is most useful, or would it be helpful to have videos on the mechanics of e.g. how to do a t-test and why/how it gets modified when there are unequal sample sizes, unequal variances, etc.? Or is it more helpful have videos with big-picture overview / how to look at different scenarios and see which test would apply?
I could say YOU’VE SAVED MY LIFE 〰️🥹