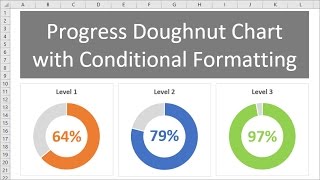
Progress Circle Chart in Excel - Part 1 of 2

ฝัง
- เผยแพร่เมื่อ 22 มี.ค. 2017
- Sign up for our Excel webinar, times added weekly: www.excelcampus.com/blueprint...
The progress circle (doughnut) chart displays the percentage of completion on a single metric. This is a simple chart that can be used in dashboards to show the progress towards a goal or target. It's basically a progress bar chart in the shape of a circle or doughnut.
DOWNLOAD the file: www.excelcampus.com/charts/pr...
In this first video, we look at how to create the progress doughnut chart in Excel. It is a simple chart that just requires 1 doughnut chart and a formula.
In part 2 of the video series, I explain how to apply conditional formatting to the chart so the color of the bar changes as the progress level changes.
Watch Part 2 - • Progress Circle Chart ...
FREE video series on Pivot Table & Dashboards: • Introduction to Pivot ... - แนวปฏิบัติและการใช้ชีวิต


![[TH] 2024 PMWC x EWC Group Stage Day 2 | PUBG MOBILE WORLD CUP x ESPORTS WORLD CUP](http://i.ytimg.com/vi/vwIQyCmNIBU/mqdefault.jpg)
![The Wall Song ร้องข้ามกำแพง | EP.202 | ตั้ม วราวุธ / เบสท์ คำสิงห์ | 18 ก.ค. 67 [1/5]](http://i.ytimg.com/vi/cwIoA7XHqnE/mqdefault.jpg)


I have followed several of your tutorials and they have been to the point and easy to follow...thanks for making this a great way to learn Excel
Excel Campus is great! Jon makes learning fun and delivers the information at a great pace in a format that makes it easy to absorb.
Wow! This was by far one of the easiest presentation and instructions I have ever seen. Thank you!
Awesome! You taught me two things: 1) it's called a "doughnut chart," and 2) how to make one. Thank you!
I love this video.
One of the interesting feature of Excel one should know this functionality. There is a lots of uses of this chart and very familier in today's world of gagets
Thanks for educating the community and appreciate your volunteership.
Good Luck!
Thank you Kris! :-)
Excellent step by step guide, clearly explained. Thank you John
Thank you for a clear, concise presentation! I appreciate you sharing your knowledge!!
This was a simple yet very informative video. Great job!
Excellent tutorial. I am tasked with creating charts and analyzing trends. This has been very helpful.
Nice, clear and short. For more artistic designs you can use other shapes to contain the number as well.
Thank you. Like everyone said, simple, to the point!
Thank you for a clear demonstration. Exactly what I needed for my Report.
Thanks! Great video that teaches all you need to know to make a good doughnut progress chart in just a few moments
Thank you Jon with such wonderful explanations and resources. So much appreciated. God bless
Simple and to the point. I feel like going and grab a doughnut right away!!!
Thanks Jon!!!Excellent and simple tutoring!!
Thanks a lot for sharing the video ! Please continue to share videos for designing professionally looking business charts.
Great lesson, I'm loving my new dashboard I built from this lesson.
Simple, easy to understand and perfect for my need. Thanks
Intelligent and simple explanation .... Bravo!
Dude! You put the jelly on the bottom shelf. Amazing!
The conditional formatting information is pretty cool, thanks!
I loved it. You explain very well and simple. Thank you!
Brilliant work John... Absolutely great work as whole video was simple and easy to learn
Very helpful - easy concept explained in a great way. Thanks Jon
great job on the amazingly well structured and instructional videos!
Great tutorial. Easy to understand and fun!
This was extremely helpful! Thanks for creating this content!
Great video. Simple and straight to the point.
Thank you for this concise and easy to follow video!
This is very helpful. I’m looking for a simple way to show the team how close to our budget goals we are each day and what they would need to accomplish to meet them. If we have a bad day for example, how much do we need to accomplish the next day in order to make up for it. I find lots of charts that show year over year, but not as many that compare goal to actual. If you have others that fit into that category, feel free to point me to them ;-) and thank you!
Really great instructions & easy to follow, thank you!
i really appreciate the way you explain
This is great very thorough and easily understood. Thank you so much this is fantastic.
Your making it happen. THANK YOU!!!
Jon, i thank you for you tutorials
Excellent video, very helpful, clearly explained
Thank you for making this easy to do!
Good information. I will be watching more of your videos. Thank You I have been subscribed for a while and learned a lot.
Thank you so much. I found this lesson very helpful.
This is very helpful. Thank you Jon.
Helped me to do exactly what I wanted, thank you so much
Amazing video and excellent lesson .. Thanks a lot Jon ❤
Muy buen video. Me ha sido de gran ayuda
I never knew the tip on how to make a text box "live"! Thanks!
Nice practice. I really love it. Thanks so much.
Great video! Was able to make it works for me, thank you!
Great video. Very helpful for me. Thank you.
That helped so much! THANKS!
Best teacher. Cheers.
Great simple explanation
This was fairly easy. Thank you
Thank you this was really helpful!
Super helpful, thank you Jon
Great tutorial, thank you
Excellent Video!
Great and Simple... thanks
thanks for this great video. very simple to follow :)
Thanks for helping us
Good stuff, much appreciated
awesome video on progress circle chart......thanku sir
Hey! I really liked this video, it actually helps me to build a report that i'm setting up.
Do you know where I could find some info on how to automate the process from raw data of a group to an individual report of every member of the group????
Great video!! Appreciate this!
Very helpful. Thank you
thank's very informative video. can apply this on construction progress report? and how..
This was so easy to follow, thank you so much! I want to visualize my savings progress to help me stay motivated. Is there a way that the actual can have multiple entries? Like for different times that I put more money aside, it can calculate the total? Thanks again.
thank you was always trying to figure out how to creat a 🍩 chart. simple tips and easy to reproduce. thank you sir
Thank you Chi! :-)
This was awesome and made simple. How would you do this with Count vs Percentages?
Quite useful, thanks!
Can you please clarify that why need to add value upto 100% and it is required for all kind of progress doughnut charts
Nice and simple. Thanks
Thanks for the video. I am trying to use this doughnut style to show % of dollars spent against income. How to currency and show % used? Thanks
Love it. Thanks
well explained, thank you
This was epic. Thanks.
Great help. Thank!
Easy to follow, thanks
luar biasa, sangat bermanfaat...salam dari Jakarta
Does this work if I have collected paper surveys that I must manually put in myself?
Basically, nobody has inputted online information...
Very clear and useful. Love it!
Great to hear! 😀
i really enjoyed.thanks alot.
Thank you very much:)
great video. thanks
Thanks for the doughnut fun!
Can you make dynamic? Meaning the % goes down as time goes by.
Thank you for sharing this, it's awesome. Would I be able to do a similar thing with values not calculated in percentage? Or a different target vs actual value. Lets say our target is 4.8, or on other cases 40%. Please guide me to a video that explains how to achieve it.
adding the text box to show the percentage does not work if the values are coming from a pivot table. Any ideas how to fix it?
Hello, thanks for the video. Do you have instructions to go with Google Drive Sheets? The Donut Chart works but I cant put the text box in the middle with the Percentage showing :(
Great video.
Hi John... This was an Excellent Video.... I wanted to know if I could put on two parameters rather than three...
Could you please reply... Love to learn from you...
Thank you so much , I have question what if I have barrel as you know not measured by 100% but something like 210 liters how can I visualize it ?
Thanks in advance
I'd like to use this or something similar to track both negative and positive values, e.g. where there is a target profit percentage for a transaction, but there may be up to a 200 percent loss as well. Any suggestions about how to do this or where to find a tutorial? Thx.
This is perfect for 3 of my 4 metrics I want to put on a dashboard for my client. We are tracking actual vs target for Revenue, Gross Profit dollars, Gross Margin, and Overhead. This doughnut chart works great for the first three, but not for Overhead, where a lower number is good. For example, our target Overhead is $18k, our actual is $15k. So, we're doing good, but a doughnut chart makes it look like our goal to get to $18k. Since the first 3 metrics are doughnut, I would like to be consistent. But I either need to reconfigure something, or a different type of chart would be more appropriate for the Overhead metric?
How do you display the progress circle over the top of the form that is transferring data to a table
Thanks fo this video! I have a question how can we show progress over 100% for example 120% It shows like 80% in this charts. Thanks a lot in advance
Why not set a conditional formatting in B2 to accept values only below 100%?
Thanks John!
THANKS.. NICE VIDEO
Good Work!!
Could you have some examples of creating a Dashboard for a Collections Department? Tipically propke use sales examples are hard to follow if what you need is to create a Dashboard from an aging for the collections team