SHAP for Binary and Multiclass Target Variables | Code and Explanations for Classification Problems

ฝัง
- เผยแพร่เมื่อ 22 พ.ค. 2024
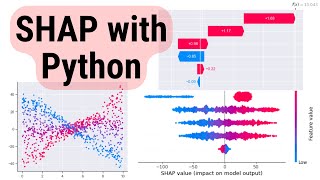
- SHAP values give the contribution of a feature to a prediction made by a machine learning model. This is also true when we use SHAP for classification. For binary target variables, we interpret these values in terms of log odds. For multiclass targets, we use softmax. In this video, we will:
- Discuss the interpretations of SHAP for classification problems
- Give the Python code for displaying SHAP plots for categorical target variables
- Explore new ways of aggregating SHAP values for multiclass targets
This knowledge will become an essential part of your explainable AI (XAI) arsenal!
🚀 Free Course 🚀
*NOTE*: You will now get the XAI course for free if you sign up (not the SHAP course)
SHAP course: adataodyssey.com/courses/shap...
XAI course: adataodyssey.com/courses/xai-...
Newsletter signup: mailchi.mp/40909011987b/signup
🚀 Companion Article (no-paywall link): 🚀
towardsdatascience.com/shap-f...
🚀 Previous tutorial and other useful articles: 🚀
Intro to SHAP: towardsdatascience.com/introd...
Maths behind Shapley Values: towardsdatascience.com/from-s...
Limitations of SHAP: towardsdatascience.com/the-li...
🚀 Get in touch 🚀
Medium: / conorosullyds
Twitter: / conorosullyds
Mastodon: sigmoid.social/@conorosully
Website: adataodyssey.com/


Great video! You explain the intermediate calculation process in SHAP very clearly!
Thanks! I'm glad you enjoyed it
Great tutorial! Very useful! Good explanations!
No problem Solomon!
So good, keep bringing more explainable ai content
Thanks Sahil! Planning to start publishing videos more regularly starting in Feb
I can hear you're from South Africa! How do you intepret shap values for categorical features? When it's Male Female, it's easy, but what if we have 15 categories? Really love the quality content on this channel!
Yes, I'm originally from Cape Town!
You have two options. Either use Catboost or sum the individual SHAP values of each one-hot encoding. I wrote these articles on the topic a while ago (no-paywall links):
towardsdatascience.com/shap-for-categorical-features-7c63e6a554ea?sk=2eca9ff9d28d1c8bfde82f6784bdba19
towardsdatascience.com/shap-for-categorical-features-with-catboost-8315e14dac1?sk=ef720159150a19b111d8740ab0bbac6d
Great video thanks. I have one question: at 4:25 waterfall plot, I did understand that you can use the record's probability to calculate f(x).
But what if I want to interpret the bar plot? (The average of absolute shap values) How should I interpret the shap value? (like 1 unit of field X increases the probability of Y about n%)
Good question! You can interpret each bar as "the feature changes the log odds of a postive prediction by X on average when compared to the average log odds" where X is the height of the bar.
Keep in mind that SHAP values are not parameters. i.e. we can not use them to understand how a prediction will change when we increase the feature value by 1 unit. They simiply tell us the contribution of a feature to a prediction in the context of the other feature values.
I hope that makes sense.They wording can be a bit tricky! If it still unclear, see time 2:00 to 3:30 in this video:
th-cam.com/video/MQ6fFDwjuco/w-d-xo.html&ab_channel=ADataOdyssey
@@adataodyssey thanks for the explanation :) I get it now. BTW my waterfall plot always shows the f(x) = 1 or 0 in the logistic model. Then, is it automatically linked from log odds to probability? In that case, can I interpret that as the average probability (%p) increase?
and I have one more question, how can I determine the direction (+/-) of the mean absolute shap values? I see they indicate magnitudes, but wanna know if there are ways I can find out the signs. Because from beeswarm plot, the relationship of certain variable looks somewhat positive but if I actually calculate the average of shap values, it is below 0 or something. So I wonder if there are some ways to get it. Again, thanks for your great video :)
1) I think with logistic regression, SHAP will default to using the linear explainer. I have personally never worked with this and so I am not sure how it affects the interpretations. I think as you are dealing with a linear model the SHAP values will be related to the parameter of the model.
2) I recommend signing up for the course ;) It goes into detail on how you can explore the SHAP values and create your own custom plots. Similar to what you want to do here! Otherwise please see the article below. It explains the SHAP values object in more detail:
towardsdatascience.com/shap-for-categorical-features-7c63e6a554ea?sk=2eca9ff9d28d1c8bfde82f6784bdba19
Hi buddy
I learnt shap from you but I am facing some issues, I am trying to plot any graph then I am getting a common error,
Error- "The beeswarm/waterfall plot requires an explanation object as the shap values argument "
Cab you please help me buddy.
Thanks
It is not possible to debug your code from that comment. Can you past your code and the actual error message?
The actual error is given below.
Error- "The beeswarm/waterfall plot requires an explanation object as the shap values arguments.
Whenever I am trying to plot something like waterfall beeswarm I am getting this error.
I can't post my code.
@@anki8136 Not sure I can be much help then. It sounds like you are not passing in a valid explanation object. For example, you get the "shap_values" is an explainer object:
#Get shap values
explainer = shap.Explainer(model)
shap_values = explainer(X)
You can sense this by printing out the values:
print(shap_values.values)
This should have dimensions equal to (#instances, #features) in your X feature matrix.
Try to run the code in this tutorial if you are still having problems:
towardsdatascience.com/introduction-to-shap-with-python-d27edc23c454?sk=01c06f166e742e2084d581e40bf0b96e
@@adataodyssey thanks
*NOTE*: You will now get the XAI course for free if you sign up (not the SHAP course)
SHAP course: adataodyssey.com/courses/shap-with-python/
XAI course: adataodyssey.com/courses/xai-with-python/
Newsletter signup: mailchi.mp/40909011987b/signup
it showing this coupon has expired I didn't sign up for both yet
@@otabeknajimov9697 Hi Otabek, unfortunately the SHAP course is no longer free. But if you sing up to my newsletter you will get a coupon for a different XAI course.