i just want it to ongratulate you!... you are the only one in you tube that can have a solid background (books and papers) about what is teaching in a video. thaank you so much... your video help me a lot!...,
Really cool video. Love the format that mix theory and coding. Just one point for disscussion: We need to measure Recall even for a binary classifier or for balanced data. It measrus a classifier's ability to find out all positive examples. And precison measures how well are the positive predictions. So they measure two different type of errors. In statistics we talk about Error of type one or type two
When the feature is not continuous, how do we sample the neighborhood? For example, binary features, Just a combination of features? or consider the binary features to be continuous ones?
LIME can explain how the Complex model behaviors about the interested sample point, but it cannot guarantee the prediction of the complex model around the sample is correct predictions. am I right? Also, we could use LIME to explain the incorrect prediction of the complex model. For example, we could take two samples one correct prediction and one incorrect one, then we could make a simple surrogate model abound the two samples so that we could see how the complex model predicts and what is wrong with the complex model. Am I right again?
I think in the last example, you cannot say the model is wrong or not. LIME just explain how it behaves near the sample. If you can explain so easily why do you use complex model. You only can say using the ground truth. Some features that you might think is not logical still might affect that specific local points.
Du bist sehr hilfreich! Quick questions from a relatively non tech person: 1) How does this scale for models with millions of params eg could you even use this on an LLM? 2) Am I right in understanding that you need a mini real data set to train locally every time then?
Hehe thanks :) 1) I'm not sure if LIME is the right approach for LLMs. As these models mainly operate on numeric vectors it's difficult to fit a simple interpretable model on these. Also there are no real features as everything is very high-dimensional. One easy approach is to look at the attention weights. This allows you to understand which words the model used and where it "looked at" for some output. I found a nice visualization of that in this blog post: mohitmayank.medium.com/explainable-ai-language-models-b4b75f56bfe2 2) Yes for every prediction a small dataset is sampled to train the surrogate model
Hi thanks for this wonderful video. I have a question, the perturbed dataset created by LIME is like fake datasets right. How do that data points have predictions or target variables?? Whether it means, the black box model is trained again on these perturbed datapoints to get the predictions??
Hi! The target variables of this fake dataset come from the "complex" black box model. This means we simply put these points into the Blackbox and use the predictions as labels. Then we fit a new simple model with this new dataset :)
I think something might be wrong with the columns in your dataframe. More specifically I would double check the column types and cast all float64 to float32 using the to_numeric function
So when we deal with classification. Is the Local Model for lime then a LogisticRegression (Linear Regression would only work for Regression problems right)? X would be the features from the nearest points to the one we want to explain. Would y be the original target (so stroke or no stroke in this case)? Thanks and great video.
Hi! Yes for a regression task a logistic regression would be fitted, for instance. X are the features of the input data point we want to explain. Out of those we would generate a neighborhood with similar features X'. y is the original target, yes, but it is not used by the algorithm, because at prediction time we don't have that information. In the code I pass y_test to the interpretml library to additionally show the actual labels. Thanks!
@@DeepFindr So we would not use samples from the training set which are close as neighbors but instead create artifical new ones? In order to get the Betas and therefore the importance how do we fit the Logistic Regression? My first understanding was using close training samples, fit the Log Reg on those and the training y's and then derive the beta/importance only from those. BR
@@DanielWeikert Hi, I guess my wording was a bit irritating here. Yes the training samples are used and weighted according to their proximity. However we do not take their (ground truth) labels y. Our labels come from the Blackbox model (the predictions on these data points), because we want to approximate it. But that also means we are not limited to the training data, we could also generate new data points by small perturpations / sampling from distributions, pipe them through the Blackbox and fit a simple model based on these labels. Hope that makes sense :)
@@DeepFindr Thanks a lot for your reply. Highly appreciated. What I still don't understand is how the blackbox model is fitted. So are the y values the original predictions on these training samples instead of the ground truth y_train?
@@DanielWeikert sure no problem :) The Blackbox model is fitted on X_train with the labels y_train. Now we have a specific data input to our blackbox model - for which the prediction is for example 0. In order to explain this prediction we want to build a simple model in the neighborhood of that point based on the decision boundary of the Blackbox. The simple model is fitted on sampled similar data points (for example coming from the train data X_train), let's call them Z_train. The labels for these samples come from the Blackbox model f, so we get y_train_simple = f(Z_train). The Blackbox model is only fitted once at an early point In time. For the explanations of the predictions we fit each time a new simple model Best
Hi, amazing explanation. I'm wondering if you could elaborate how the size of proximity is decided upon? How we do know how "large" the neighborhood is for the newly fit linear model? Realistically, we could just choose a few close points and fit a linear model there, but that might not be the best fit? I hope my question makes sense.
Great explanation! Thanks! Quick question: I was wondering what is the reason behind providing LIME with training dataset (line 29), what does it do with it? I understood that testing dataset (line 32/33) is used to do perturbations and create a simpler model? Thanks!
Hi! This is used to calculate feature statistics when the parameter discretizice_continuous is passed. Otherwise it's simply ignored.. You can have a look here to see how it is used in detail: github.com/marcotcr/lime/blob/master/lime/lime_tabular.py
Thank you for the wonderful step by step explanation, it really goes a long way. However, implementing same explanation procedure on a Conv1D CNN model for binary classification throws an error message that "AttributeError: 'Sequential' object has no attribute 'predict_proba'". Please, any replacement for the "predict_proba' method?
Really great video. I am trying to implement lime for one of our use cases and features contribution is changing on every run for the same input transaction. Is that the expected behavior? Example- For property price prediction- Property age is contributing 25% and while running the explainability again, without modifying anything contribution is changing to 28%. How can we control it?
Hi! Thanks :) Mhh because the sampling of new data points includes some randomness, it might be the case that this affects the contribution. It's basically like each time a different dataset is used to calculate the contributions. You could try to set a random seed and always use the same one. You can read more about it here: github.com/marcotcr/lime/issues/119 Best regards :)
As it is model agnostic it should in principle work with any machine learning model, so also RNN :) However I have never tried to use it and also I think it is difficult to work with a sequence of data inputs. Here is an example for a LSTM: towardsdatascience.com/interpreting-an-lstm-through-lime-e294e6ed3a03
Hi! I think it's possible. For approximating the model you need to have labels to compare against. If you are able to construct these labels for an unsupervised approach it works. Such a thing could be the probability of being assigned to a cluster. With that information I think lime can be used. For SHAP you can use Isolation Forest as unsupervised model being explained by the Tree Explainer.
Hey thanks for the clean explanation! I wanted to know if you have tried LIME with multiple class classification problem, aside from the binary classification already in the video? Thanks
Hi! I haven't tried it before, but maybe this website is useful for you: coderzcolumn.com/tutorials/machine-learning/how-to-use-lime-to-understand-sklearn-models-predictions#lime_tabular_ex3 They have an example for a multiclass classification case :) Thanks!
Hi, DeepFindr First of all sorry for hurting your sentiments as a developer. Actually, i have created the video for sharing among the closed group as part of a series of video sessions, and in these sessions, I properly cited your work and mention the source, But mistakenly I set the visibility of this video as public without noticing that it is not referencing any source. I feel sorry for this mistake. I have removed the video for the public, However, I have added the references and sources. And moreover, i will edit it and will include it in the video itself. I am a great fan of you and love the way you have explained XAI and in no way want to hurt my Guru. I again feel sorry for my unintended action and thanks for pointing and correcting me. Keep doing good work. Wish you all the best,
Hey! No worries, it's all fine :) At first I was a bit surprised, but then I thought it's not really a problem, as your goal is to share knowledge and that's what it's all about. You can keep everything public as you wish. Thanks for your kind words! Wish you all the best as well!
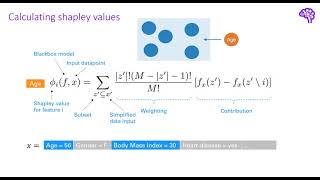
Thank you! z' is a perturbed sample and z is the original representation. Thanks for pointing this out, I somehow missed it when creating this video. Z is then the full sample (passed to the Blackbox) and z' contains only a fraction of the non-zero elements and goes to the surrogate model. The idea is to get simpler data points that make it easier to explain predictions.
@@DeepFindr Thank you for your very fast answer! So: Instance to be explained --> x Random perturbations based on x --> Z A sample of the random perturbations Z --> z' Am I right?...
Hi, yes more or less. For the last relation I would maybe call it "simplified version" of z. So x is the original data point, x' it's simplified version. Therefore z is a perturbed sample and z' it's simplified version. For images for example they use superpixels as interpretable (simplified) version. For text data they use a (sampled) bag of words representation. But to get these simplified versions they sample again, as you said :)
Thank you for the amazing explanation! Have you by any chance encountered researches regarding XAI in industrial applications, such as threaded fastening?
Hi! I think there is a lot of potential for XAI in the industry. Some years ago I also did a project on material sciences. A company produced products to damp vibration and squealing. Basically they wanted to know which material combinations lead to a certain behavior and why. But I have no publication for that, because of two reasons: - I used counterfactual explanations and had my own implementation but didn't really contribute to / extend current research - Most companies want to keep such advances secret to have a competitive advantage And I think these are the reasons why there is generally not too much available in that direction. There are some meta papers, like this one arxiv.org/abs/2106.07758 but it's difficult to find very specific applications. Best regards


One of the best and wholesome explanations on this topic! Kudos!
i just want it to ongratulate you!... you are the only one in you tube that can have a solid background (books and papers) about what is teaching in a video. thaank you so much... your video help me a lot!...,
Wow, very clear and concise explanation of a fairly complex technique. Thank you very much for the effort you put in to this. Very helpful!
The objective function part is amazingly well explained.
Very well prepared and carefully delivered, congratulations and many thanks for your help in understanding LIME.
Wow! Such a cool explanation. I had some intuition issues after reading the paper that are now solved due to this video. Thanks a lot!
Concise and great explanation on the topic.
great work! I am a lucky person cuz I found this channel, as My major interests are GNN and XAI. thank you so much for brilliant works.
Perfect :)
Finally a channel with good content!
Amazingly clear explanation.
Really cool video. Love the format that mix theory and coding. Just one point for disscussion: We need to measure Recall even for a binary classifier or for balanced data. It measrus a classifier's ability to find out all positive examples. And precison measures how well are the positive predictions. So they measure two different type of errors. In statistics we talk about Error of type one or type two
Thanks!
Yes you are right. Ideally it makes sense to look at all the metrics that are commonly used :) ROC, accuracy, precision, recall,...
thank you so much for the splendid explanation!
Really amazing!! It's very exciting and cool to conduct such research; it is also very explainable."
wow 💯 Great explanation
Excellent explanation of LIME.
When the feature is not continuous, how do we sample the neighborhood? For example, binary features, Just a combination of features? or consider the binary features to be continuous ones?
Beautifully explained
Damn bro, this helped me a lot with my final thesis
That's great :) good luck with it!
It is just clearly explained ! Thanks a lot
LIME can explain how the Complex model behaviors about the interested sample point, but it cannot guarantee the prediction of the complex model around the sample is correct predictions. am I right? Also, we could use LIME to explain the incorrect prediction of the complex model. For example, we could take two samples one correct prediction and one incorrect one, then we could make a simple surrogate model abound the two samples so that we could see how the complex model predicts and what is wrong with the complex model. Am I right again?
Amazing Explanation!!!. Thank u
Sir how can we use it with NN?
I think in the last example, you cannot say the model is wrong or not. LIME just explain how it behaves near the sample. If you can explain so easily why do you use complex model. You only can say using the ground truth. Some features that you might think is not logical still might affect that specific local points.
13:20 I believe "edu" has something to do with "atheism" :) Thanks for the explanations!
Haha yes might be ;-)
Thank you for the amazing explaination
Can Lime be used for unsupervised ML algorithms?
Why do you use different z and z' for f(z) and g(z')? I cannot get it.
Does LIME uses Permutation or Perturbation (tweaking feature values) of the input of interest (x) we would like to explain?
Fantastic !!!
Du bist sehr hilfreich! Quick questions from a relatively non tech person:
1) How does this scale for models with millions of params eg could you even use this on an LLM?
2) Am I right in understanding that you need a mini real data set to train locally every time then?
Hehe thanks :)
1) I'm not sure if LIME is the right approach for LLMs. As these models mainly operate on numeric vectors it's difficult to fit a simple interpretable model on these. Also there are no real features as everything is very high-dimensional. One easy approach is to look at the attention weights. This allows you to understand which words the model used and where it "looked at" for some output. I found a nice visualization of that in this blog post: mohitmayank.medium.com/explainable-ai-language-models-b4b75f56bfe2
2) Yes for every prediction a small dataset is sampled to train the surrogate model
Hi thanks for this wonderful video. I have a question, the perturbed dataset created by LIME is like fake datasets right. How do that data points have predictions or target variables?? Whether it means, the black box model is trained again on these perturbed datapoints to get the predictions??
Hi! The target variables of this fake dataset come from the "complex" black box model. This means we simply put these points into the Blackbox and use the predictions as labels. Then we fit a new simple model with this new dataset :)
Hello there, i got a an error like "ufunc 'subtract' did not contain a loop with signature matching types (dtype('
I think something might be wrong with the columns in your dataframe. More specifically I would double check the column types and cast all float64 to float32 using the to_numeric function
So when we deal with classification. Is the Local Model for lime then a LogisticRegression (Linear Regression would only work for Regression problems right)? X would be the features from the nearest points to the one we want to explain. Would y be the original target (so stroke or no stroke in this case)?
Thanks and great video.
Hi! Yes for a regression task a logistic regression would be fitted, for instance. X are the features of the input data point we want to explain. Out of those we would generate a neighborhood with similar features X'.
y is the original target, yes, but it is not used by the algorithm, because at prediction time we don't have that information.
In the code I pass y_test to the interpretml library to additionally show the actual labels.
Thanks!
@@DeepFindr So we would not use samples from the training set which are close as neighbors but instead create artifical new ones?
In order to get the Betas and therefore the importance how do we fit the Logistic Regression?
My first understanding was using close training samples, fit the Log Reg on those and the training y's and then derive the beta/importance only from those.
BR
@@DanielWeikert Hi, I guess my wording was a bit irritating here. Yes the training samples are used and weighted according to their proximity. However we do not take their (ground truth) labels y. Our labels come from the Blackbox model (the predictions on these data points), because we want to approximate it.
But that also means we are not limited to the training data, we could also generate new data points by small perturpations / sampling from distributions, pipe them through the Blackbox and fit a simple model based on these labels.
Hope that makes sense :)
@@DeepFindr Thanks a lot for your reply. Highly appreciated. What I still don't understand is how the blackbox model is fitted. So are the y values the original predictions on these training samples instead of the ground truth y_train?
@@DanielWeikert sure no problem :)
The Blackbox model is fitted on X_train with the labels y_train.
Now we have a specific data input to our blackbox model - for which the prediction is for example 0. In order to explain this prediction we want to build a simple model in the neighborhood of that point based on the decision boundary of the Blackbox.
The simple model is fitted on sampled similar data points (for example coming from the train data X_train), let's call them Z_train.
The labels for these samples come from the Blackbox model f, so we get y_train_simple = f(Z_train).
The Blackbox model is only fitted once at an early point In time. For the explanations of the predictions we fit each time a new simple model
Best
What is this for? I am intrigued ( im a musician)
Hi, amazing explanation.
I'm wondering if you could elaborate how the size of proximity is decided upon? How we do know how "large" the neighborhood is for the newly fit linear model? Realistically, we could just choose a few close points and fit a linear model there, but that might not be the best fit? I hope my question makes sense.
Great explanation! Thanks! Quick question: I was wondering what is the reason behind providing LIME with training dataset (line 29), what does it do with it? I understood that testing dataset (line 32/33) is used to do perturbations and create a simpler model? Thanks!
Hi! This is used to calculate feature statistics when the parameter discretizice_continuous is passed. Otherwise it's simply ignored..
You can have a look here to see how it is used in detail:
github.com/marcotcr/lime/blob/master/lime/lime_tabular.py
Thank you for the wonderful step by step explanation, it really goes a long way. However, implementing same explanation procedure on a Conv1D CNN model for binary classification throws an error message that "AttributeError: 'Sequential' object has no attribute 'predict_proba'". Please, any replacement for the "predict_proba' method?
Hi, have you tried the recurrent Explainer as suggested here: github.com/marcotcr/lime/issues/426
No, just seeing it. I'll give it a try.
Thank you for the timely response.
Really great video. I am trying to implement lime for one of our use cases and features contribution is changing on every run for the same input transaction. Is that the expected behavior? Example- For property price prediction- Property age is contributing 25% and while running the explainability again, without modifying anything contribution is changing to 28%. How can we control it?
Hi! Thanks :)
Mhh because the sampling of new data points includes some randomness, it might be the case that this affects the contribution. It's basically like each time a different dataset is used to calculate the contributions.
You could try to set a random seed and always use the same one.
You can read more about it here: github.com/marcotcr/lime/issues/119
Best regards :)
@@DeepFindr Thank you. This helps. I will try to set the random seed.
Can we use Lime for RNN? Or we need to work on Shap?
As it is model agnostic it should in principle work with any machine learning model, so also RNN :)
However I have never tried to use it and also I think it is difficult to work with a sequence of data inputs.
Here is an example for a LSTM:
towardsdatascience.com/interpreting-an-lstm-through-lime-e294e6ed3a03
Thanks for this. Its funny that "ever_married" feature is inversely proportional to getting a stroke :)
:D true!
Concepts explained "PERFECTLY" !! Do we have slides of these videos?
Hi :) thanks!
I haven't uploaded them but you can send a mail to deepfindr@gmail.com and I will attach them :)
@@DeepFindr Thank you so much!
Hi! Can LIME be used for Unsupervised approaches?
Hi! I think it's possible. For approximating the model you need to have labels to compare against. If you are able to construct these labels for an unsupervised approach it works.
Such a thing could be the probability of being assigned to a cluster. With that information I think lime can be used.
For SHAP you can use Isolation Forest as unsupervised model being explained by the Tree Explainer.
Hey thanks for the clean explanation! I wanted to know if you have tried LIME with multiple class classification problem, aside from the binary classification already in the video? Thanks
Hi!
I haven't tried it before, but maybe this website is useful for you:
coderzcolumn.com/tutorials/machine-learning/how-to-use-lime-to-understand-sklearn-models-predictions#lime_tabular_ex3
They have an example for a multiclass classification case :)
Thanks!
@@DeepFindr thank you!!
Hi, DeepFindr
First of all sorry for hurting your sentiments as a developer. Actually, i have created the video for sharing among the closed group as part of a series of video sessions, and in these sessions, I properly cited your work and mention the source, But mistakenly I set the visibility of this video as public without noticing that it is not referencing any source. I feel sorry for this mistake.
I have removed the video for the public, However, I have added the references and sources. And moreover, i will edit it and will include it in the video itself.
I am a great fan of you and love the way you have explained XAI and in no way want to hurt my Guru. I again feel sorry for my unintended action and thanks for pointing and correcting me.
Keep doing good work.
Wish you all the best,
Hey! No worries, it's all fine :)
At first I was a bit surprised, but then I thought it's not really a problem, as your goal is to share knowledge and that's what it's all about. You can keep everything public as you wish.
Thanks for your kind words! Wish you all the best as well!
Thank you very much for this excellent explanation. One short question: What is the difference between z and z'?
Thank you!
z' is a perturbed sample and z is the original representation.
Thanks for pointing this out, I somehow missed it when creating this video.
Z is then the full sample (passed to the Blackbox) and z' contains only a fraction of the non-zero elements and goes to the surrogate model.
The idea is to get simpler data points that make it easier to explain predictions.
@@DeepFindr Thank you for your very fast answer! So:
Instance to be explained --> x
Random perturbations based on x --> Z
A sample of the random perturbations Z --> z'
Am I right?...
Hi, yes more or less. For the last relation I would maybe call it "simplified version" of z.
So x is the original data point, x' it's simplified version.
Therefore z is a perturbed sample and z' it's simplified version.
For images for example they use superpixels as interpretable (simplified) version. For text data they use a (sampled) bag of words representation.
But to get these simplified versions they sample again, as you said :)
@@DeepFindr Thank you! :-)
Thank you for the amazing explanation!
Have you by any chance encountered researches regarding XAI in industrial applications, such as threaded fastening?
Hi! I think there is a lot of potential for XAI in the industry. Some years ago I also did a project on material sciences. A company produced products to damp vibration and squealing. Basically they wanted to know which material combinations lead to a certain behavior and why. But I have no publication for that, because of two reasons:
- I used counterfactual explanations and had my own implementation but didn't really contribute to / extend current research
- Most companies want to keep such advances secret to have a competitive advantage
And I think these are the reasons why there is generally not too much available in that direction. There are some meta papers, like this one
arxiv.org/abs/2106.07758
but it's difficult to find very specific applications.
Best regards
perfect!
Wonderful explanation!!! Thank you!!!
nice video
Did not get :( moving to other videos