Exploratory Data Analysis With Excel - Part 1 - Basic Numerics

аёқаёұаёҮ
- а№Җаёңаёўа№ҒаёһаёЈа№Ҳа№ҖаёЎаё·а№Ҳаёӯ 4 аёӘ.аё„. 2024
- My full tutorial on exploratory data analysis (EDA) with Microsoft Excel. In this series I will introduce you to some of the most useful data analysis techniques in business analytics using trusty old Excel.
Throughout the series I will show you how to use the best that Excel has to offer for EDA:
1 - The mighty Data Analysis ToolPak
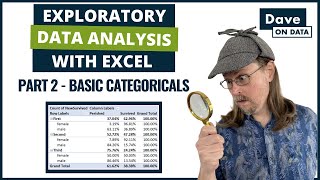
2 - Data visualizations like histograms, boxplots, and bar charts.
3 - Pivot tables
4 - Pivot charts
These are the same techniques that I've used in my hands-on analytics work (e.g., as part of my EDA for building machine learning models).
вҳ• If you found this content useful and would like to support the channel, you can buy me a coffee: www.buymeacoffee.com/DaveOnData
вҳ…вҳ…вҳ… My online data analysis courses в–¶ school.daveondata.com
-----------------------------------------------------------------------------------------------------------------------
Video Resources
-----------------------------------------------------------------------------------------------------------------------
рҹ“— Get the Excel workbooks рҹ“—
All the Excel workbooks used in this series are available here:
github.com/DaveOnData/Explora...
рҹ“ә Part 2 of the Series - Basic Categoricals: вҖў Exploratory Data Analy...
рҹ“ә Part 3 of the Series - Histograms: вҖў Exploratory Data Analy...
рҹ“ә Part 4 of the Series - Box Plots: вҖў Exploratory Data Analy...
рҹ“ә Part 5 of the Series - Bar Charts: вҖў Exploratory Data Analy...
рҹ“ә Part 6 of the Series - Scatter Plots: вҖў Exploratory Data Analy...
рҹ“ә Part 7 of the Series - TreemapCharts: вҖў Exploratory Data Analy...
-----------------------------------------------------------------------------------------------------------------------
вқ“ Want to up-level your data analysis skills?
-----------------------------------------------------------------------------------------------------------------------
рҹ‘©вҖҚрҹ”¬рҹ‘ЁвҖҚрҹ”¬ Learn to use your basic Excel skills to analyze the business like a Facebook data scientist:
рҹ“ә вҖў Introduction to Busine...
рҹӨ– From Excel to Machine Learning. No, Really! рҹӨ–
Yes, you read that correctly. ANY professional can move from Excel pivot tables to analyzing data using machine learning. рҹ’Ҙ
Check out the following TH-cam video to learn more:
вҖў From Excel to Machine ...
Stay healthy and happy data sleuthing!
#ExploratoryDataAnalysis #ExploratoryDataAnalysisWithExcel #EDA #EDAwithExcel - аё§аёҙаё—аёўаёІаёЁаёІаёӘаё•аёЈа№Ңа№ҒаёҘаё°а№Җаё—аё„а№Ӯаёҷа№ӮаёҘаёўаёө


рҹ’Ҙ From Excel to Machine Learning. No, Really! (Full Webinar) рҹ’Ҙ
рҹ“ә th-cam.com/video/b6hiyLEFA_M/w-d-xo.html
рҹ‘©вҖҚрҹ”¬рҹ‘ЁвҖҚрҹ”¬ Learn to use your basic Excel skills to analyze the business like a Facebook data scientist:
рҹ“ә th-cam.com/video/xIXymabyFIM/w-d-xo.html
Hi Dave, I came across your videos on Excel, R, and SQL recently. Believe me, you are one of THE BEST in teaching. I love the way you explain each concept and help the budding data scientists. I myself have been in teaching for nearly 12 years but have seen very few like. Keep doing such a great job. May GOD bless you and your family. Keep smiling and helping everyone. Cheers :)
Thank you so much for taking the time to provide this feedback - it is very much appreciated! рҹҷҸрҹҷҮвҖҚвҷӮпёҸ So glad you like the content.
Hi Dave, can I use this session for sensor data analysis in excel. This video looks promising.
Currently a business data analyst and I must say this is gold. Obtaining my masters in data science graduating in June of 2022, and you put my professors to shame. Clear and straight to the point. Will definitely be checking out more of your stuff.
I am so happy that you decided to teach this topic. I will be watching the others in the series. Very clear delivery. Thanks.
Hi David! This is pure gold. Thanks for sharing your knowledge!
You're fantastic David. Thank you so much for these videos. I'm learning so much. Please keep them coming. You're a lifesaver.
David - just came across your series.. these are fantastic... and appreciate the patient teaching. Love the content and style in your videos! Thanks for doing these!
You Rock, DavidрҹҳҖ
Absolutely love your videos and I am a beginner in Data Analysis
Thank you so much! This was super helpful.
Just getting to these videos. They are fantastic for people looking to use data to find things out
you are one of the best teachers I must say very useful videos. very informative, clear and to the point.
Wow! Thank you so much for the feedback. I am glad you are finding my videos useful.
very great sir you have dive into the concepts that i am looking for a long time finally here thank you
Thank you so much! Great video and teaching. I can't wait to learn more from you!
You are welcome and so glad you are finding my content useful!
Great video! Showed up in my recommended a couple days ago and I plan to watch many more on your channel.
Excellent! Thank you for taking the time to comment and so glad you liked the video.
These videos are so easy to follow! Thanks David!
You are welcome and glad you are finding the content useful!
Thank You. You are helping me understand and put to use the basic statistics I learned from GradCoach channel. I truly appreciate your work.
ya so the teacher sent a whole playlist of this, which is great!
Awesome! So glad you are finding the content useful.
I love your way of teaching man.
Thank you for the feedback!
I hope that you find the other tutorials on my channel of similar quality.
Excellent thanks рҹ‘Қ
this is what i am looking for... thank for the add in... it's so usefull...\
You are welcome! FYI - Parts 3 & 4 will be out Wednesday and Friday of this week.
thank you David.Great video.
You are welcome, glad you liked the content!
thanks a lot!
Amazing!
Thank you so much! I'm glad you enjoyed the video.
Exploratory data analysis can have many hearts, don't worry about it!рҹҳӮ
5:00 is pretty insightful... I have not heard that much before.
thank you
Hey dude... You rock.
Thank you for the feedback! I will try to keep on rocking it with the content. рҹӨҳ
Hi, Dave! Thank you for this video, it really came handy. I have one question, is it ok to use the mean gotten from the description analysis to fill in the blanks in the age column? Looking forward to your response.
Hello David,
Is it possible to automate output of summary statistics in formula or something instead of going through the process over and over again?
Hello David,
I hope you are doing well!
I havenвҖҷt included any project in my resume, should I include this as my project in my resume? Will this project be effective for entry level data analyst job?
Hi David!
Great material. I am really going to keep watching your videos. I like the way you teach.
One question, when you did a descriptive and summary statistics on the identifier column I was wondering if that is typical thing? I would like to know more reasons on why to perform descriptive and summary statistics on identifiers.
Thank you for the feedback, glad you are liking the content!
In general, if you know the column is an identifier (e.g., CustomerID), then there's not need to perform summary stats on it.
However, there are times when you are working with new data (especially in legacy systems) where columns turn out to be identifiers, even though they are not explicitly labeled such. One common example are database columns that get reused for some long-forgotten reason (trust me, it happens рҹҳҒ).
Hi again @@DaveOnData , I really appreciate you taking time and answering :) Im new when it comes to statistics so I'm eager to learn everything about it.
Thank you for sharing in this video by using dataset on your github account, in addition to i will also try to implement in R :)
You are welcome! Trying EDA in R is a very good idea (shocking coming from a R fan like myself, no? рҹӨЈ).
@@DaveOnData i knew, you love to use R programming from linkedln :))
we should perform whole eda after cleaning and pre processing the data, Right?
Has your hair, got longer over the years? When I started learning R ( five or six years ago) your videos was some of the first I watched.
Hi David, I really like your videos. Just to make you aware that all your links of "Part 7 of the Series - TreemapCharts" in the all the other parts direct us to Part 2. I managed to find the video typing it, but so you are aware that the hyperlink to part 7 is not the right one. Take care and thanks!
data analysis toolpack works even in ms excel 2010
Hi Dave,
I can not download datasets from your github.
hi, can i get the raw data please???
What really means Descriptive Statistics. I am extreme beginner. Can you give me some scenarios examples.
No we can use male column if we want to what is % of male and female on the ship and which are the and male and female we can combined with age and in categorical and which class people are most affected in this tragedy..
Palsson, Master. Gosta Leonard
Age- 2
Survived- 0
рҹҳў
Formula??
where you from
ЩҠЩӮШҜШұ ШӯШҜ ЩҠШ№Ш·ЩҠЩҶЩҠ Щ…ЩҲШ§Ш¶ЩҠШ№ Ш§Щ„ЩҒЩҠШҜЩҠЩҲ
ЩҮЩ„ ШұШӯ ЩҠШҙШұШӯ ШЈЩғШіЩ„ Щ„Щ„Щ…Ш§ЩҠШ№ШұЩҒ ШЁШ§Щ„Щ…ШұЩҮ ЩҲЩ„Ш§ Щ„Ш№ЩҶШҜ Щ…Ш№ШұЩҒШ© Ш№Ш§Щ…Ш© Ш№ЩҶЩҮ
Can someone tell me what are the main Articles in this video
Is he going to tell basics of excel or more complicated
If the question isn't clear please tell me to clarify the question
This video tutorial series covers data analysis fundamentals. The series assumes basic Excel knowledge like creating Excel tables, PivotTables, and charts.
@@DaveOnData THANK YOU FOR ANSWERING QUICKLY
so much hands