ฝัง
- เผยแพร่เมื่อ 17 ธ.ค. 2023
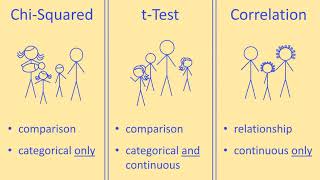
- Linear regression is the same idea as a line of best fit. The TI will allow users to input data into tables and calculate various statistics, plus graph scatterplots, box/whiskers plots, or histograms. LinReg(ax+b) will show the equation of the line of best fit, which is also viewable on the plot for some TI users. Correlation (r^2) shows how closely associated the variables are, which is also observable in graphical or tabular format.