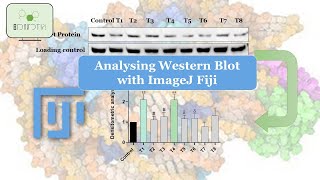
After you put the rectangular box on the first lane, click analyze > gels> select first lane. then you just need to drag the rectangular box and put on the second lane. So when you click analyze > gels> select first lane, under the hood, it copies the first rectangular box. You need to move that to the second lane. For that, You drag and drop on the second lane. And when you drag and drop on the second lane, then click analyze > gels>select next lane. And then you drag and drop from second to the third lane. same applies to the fourth. Hopes that helpful.
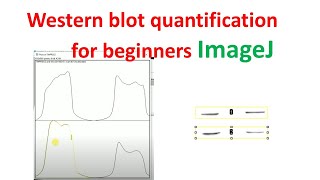
After selection of the plot why the quantification is showing not only for the area under curve its also including near by places in my case. Any solutions?
If I understand correctly, I would say you might have problem in plot selection. Watch carefully from 2:30. when you draw line it need to touch the both side of curve. LMK if you have more questions.


I was at first confused why there was no vocal explanation, but this video was more helpful than the majority of what I could find online
Glad that you found it helpful
every time I need to do the quantification I come back to this video. Thank you so much.
Hello, can you elaborate on how to quantify autoradiograph image?
How did you put rectangular boxes on lane 2 3 and 4? I am not able to put it
After you put the rectangular box on the first lane, click analyze > gels> select first lane. then you just need to drag the rectangular box and put on the second lane. So when you click analyze > gels> select first lane, under the hood, it copies the first rectangular box. You need to move that to the second lane. For that, You drag and drop on the second lane. And when you drag and drop on the second lane, then click analyze > gels>select next lane. And then you drag and drop from second to the third lane. same applies to the fourth. Hopes that helpful.
Hi! I need help, how do I contact to you ? Please reply
Thanks
Thank you, it was really helpful
It was helpful. Thank you.
Thank you so much. Got what I needed.
You are welcome.
Thank you!
Good one, keep it up
Thank you, I will
Thank you very much
You are welcome
Funny how everyone has made blots of HSP90. Hilarious tbh.
After selection of the plot why the quantification is showing not only for the area under curve its also including near by places in my case. Any solutions?
If I understand correctly, I would say you might have problem in plot selection. Watch carefully from 2:30. when you draw line it need to touch the both side of curve. LMK if you have more questions.
same here any solution?