How to quantify gel bands in imageJ | common quantification mistake

ฝัง
- เผยแพร่เมื่อ 13 พ.ค. 2024
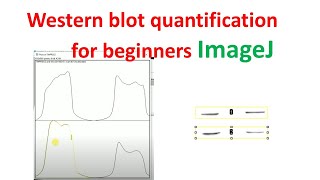
- This tutorial shows the process of gel bands quantification in ImageJ. The quantification process is the same for western blot protein bands. In the last part of the tutorial, I troubleshoot the common quantification mistake that you might encounter during the quantification. Such a mistake can lead to a wrong quantification value, whereby a band with the lowest intensity can give a higher value.
- แนวปฏิบัติและการใช้ชีวิต


This is the most helpful video of all i have watched today. Thanks a lot!
Glad you liked it, thanks for watching
fantastic video! Thank you for making it!
It's a pleasure. Thanks for your kind comment
Thank you, for this tutorial This is very helpful!!
You're welcome!
Thank you so much! This video is very helpful. I used it to quantify my gel electrophoresis bands from CRISPR deletions.
also you've earned my subscription! Keep making more content like this!
You're welcome, I'm delighted you found it useful.
Thanks for subscribing
thanks for the helpful video. how report the intensity in what units? and do you know how to perform the analysis if i perform a qualitative rt pcr, where i have my bands for the control gene and the interest gene in samples control and treatment? thanks in advance.
Thank you very much for the video! It help me a lot.
Hi Joy, I'm glad you found it useful. thanks for your kind feedback
Thanks for your video! It is really helpful!
You're welcome, glad you found it useful
Your video was very helpful, thank you.
You're welcome 😊
very helpful!
thank u for the tutorial! :)
You're welcome!
thanks for the tutorial🙏
You're welcome 😊
Thanks! Well explained!
Glad it was helpful! thanks for watching
This accent is so soothing. Thank you! 😀
Glad you think so!
The accent is simply so amazing; she's my sister.
Hi JOB
@@AliceritaE Hi my sister.
Thank you for your video. Your sample picture is clean. What should I do to deal with dirty background? Some background area is even stronger than the band.
Draw an ROI on thr background and measure it.
Then go to PROCESS/Math/Subtract (enter the value from the ROI that you measure) then click okay.
This step should remove the background
Thank you this is very helpful for me who is the first to use. :>
You're welcome.
Informative video... 👍
#AVMCreations
Thanks
Thank you so much for this vedio
Love from Kashmir #
You're welcome Bisma, greetings from England
informative as usual
Thanks
Thank you so much.
It's a pleasure 🙏
Thanks for watching 🙂
Thank you so much for this video! Please how do I duplicate the rectangle. When I try it just starts a new rectangle
Hello, you can click on crtl + D to duplicate the rectangle.
@@AliceritaE thank you! I tried that, it works for the first 2 lanes (,2,3) but after that it makes the lane I marked as 3 and tried to duplicate become a black box and then 3 moves over
That's strange! The bands have to be in the same lane. If you change the lane, that may happen.
I will troubleshoot tomorrow and record a new video if the process has changed.
hello,thank you for your video.I am wondering when I select the second lane,it automatically goes back to the fist line position.How could I do,I can choose next lane?Thank you
Hi Yuxin,
After you have selected the first lane and marked it as first, when you move it to the second lane, you need to mark it as next until you get to the last one.
You are awesome.thanks
You're welcome 😊
Thanks a lot.
You are welcome Francesco
Thank you so much for the video, please how can we use excel to calculate and plot using graph pad prism, please???
I will prepare a tutorial at the weekend to address this. mote people have asked this question
Hi @SAGIR
I founf a tutorial that explains the calculation very well. Here is a link to watch it. th-cam.com/video/5sv75Ejiuc4/w-d-xo.html
Fantastic video, thanks!! I am trying to do the same but when I select the second lane (going horizontally), it automatically goes back to a vertical position. How can I force it to go horizontally?
Hi Lydia, by default, the peak measurement data for gel quantification is given as a long vertical graphs.
Thank you a lot
yes you can quanitfy with the same method. You just need to measure the control sample in the same way and then use it to measure the ration of your protein to control
Hello, can i use this method to estimate the mass of the band and does this method take into account of background readings?
this method unifies the background readings for all the samples (provided the same paramerters was used). By mass, do you mean the molecular weight? I found a guide eon Bio-RAD www.bio-rad.com/webroot/web/pdf/lsr/literature/Bulletin_6210.pdf
Alicerita
Thank you so much 😊
You're welcome 😊
Hi. Thanks for the great video! May I bring up a question? Is the area measuring the size of the bands or their signal intensity? Thanks!
Hello! The measurement is for the intensity
@@AliceritaE Thank you so much for the clarifications!
You're welcome 😊
very useful video, thank you very much, do you know how to do the further excel calculations and graph, please?
First normalise your data by using by using smallest value to divide all the samples. To get the first ratio.
To get the second ratio, divide the protein of interest by the reference sample (use the value of ratio one)
There is a tutorial online, here is the link th-cam.com/video/9fipZozYuos/w-d-xo.html
@@AliceritaE I really appreciate your help and reply, but my supervisor want the mean and mean reciprocal method for quantification which I could not find until now !
Did you check out yhe link i sent to you. the lady calculated the mean.
@@AliceritaE yeah, I checked it and it is different from what I should do 😓
Hi, I have a western blot image that is so faint on an x-ray film. After plotting the bands, the resulting images were kind of zigzag with no specific peak but several. How do I get to the area?
Hello Makchit,
You can try to enhance the gel image. Go to imageJ
PROCESS// ENHANCE CONTRAST
then try plotting the area again
@@AliceritaE Okay, I will get back to you, thank you.
You're welcome 😊
is it possible to rotate the lane to see pick of my gel?
It might be possible. Give it a try
thanks
Alice I would love your help in my research
I don't know how to contact you. Your video has enlightened me a lot on certain points.
You're so welcome!
I am glad you found it useful. you can contact me via e-mail of linkedln from my youtube profile
@@AliceritaEok thank you for your reply.
Blessing.
May I have your email, please?
alice4all42@gmail.com
what version of image j did you use here?
Hi Aniebiet, My versionis currently v1.53i. There is a new update for v1.53k, which I will install later
Hello! May I know what format the image of the gel should be in? Does Jpeg work? Also, does the same process apply to gel electrophoresis results?
Hi Lamia, the Gel image can be in any formats
Hello! I was wondering the same, could we use this method for gel electrophoresis results?
Hi Aliki, yes you can use this method. The image I used in the tutorial is jpeg, it can also be tiff, it doesn't matter.
@@AliceritaE thank you!!
You're welcome
What do I do once I have the area to find the protein concentration?
If you follow the video, you will get the value of the protein concentration. You need to do some calculations using the blade of the control to work out the ratio of the protein.
Mam my image is an RGB color. Is it ok or should I convert it into a grayscale image?
Please convert it to 8bit image first
How do you duplicate on the keyboard when you make the first square? Because they have to be the same size
Press T
It added the location to a ROI manager from which you can then click on it to paste it on the new images.
Keyboard shortcut
T to save ROI to a manager
Shift + Control + E to paste
Mam how do you move these plots downward so you can draw a separate line in each peak? please tell me
You can press the down arrow key in your keyboard to move to the next peak.
@@AliceritaE yes mam am trying but its not working i don't know why
I'll check tomorrow morning
Does it matter the image type? I mean 8, 16, 32 bit ??
no, it doesn't matter. Converting to 8 bit helps to convert shaded or coloured gel into black and white image.
How to duplicated the rectangle?
th-cam.com/video/KjYoro4wPM4/w-d-xo.html
Hi, my question is how do I quantify proteins on X-ray films
HellO MAKCHIT, You need to scan the xray film to a digital photo format. And then follow the steps I used in the tutorial to quantify your protein.
@@AliceritaE Yes, that has been done and followed the tutorial. I plotted the lanes but the peaks were not giving me appreciable values, so I tried densitometry where I calculated the ratio of the protein on x-ray film: the value of total protein on each lane on SDS gel stained with Coomassie. Do you think I have done the right thing?
the ratio measurement is corrrect. did you include a control in your analysis. that gives extra detail regarding about the sample
lines disappear, any solutions?
You mean the line from thr plot disappeared. Try and repeat the step
Any luck?
@@AliceritaE Problem solved, thank you
Excellent
8 minutes to only mention that the line should touch wtf
You're welcome!
If you have gone through the comment section, you would have seen that it's more than just drawing a single line. But to each one their own 😏
@@AliceritaE I just meant that I expected more troubleshooting according to the title, a bit clickbaity hahaha but nice video
@carlinlapo you're the first to call the video a click bait.
The video tutorial cannot accommodate everyone's curiosity. It provides the basic into gel quantification.
If you're working with western blot gel, you need further steps and which you can do by yourself if you have the equation for the quantification.
@@AliceritaE that's what genius do, be the first one to discover something !! 😀