Equation of Line of Best Fit - Statistics & Data Analysis - [8-9-7]

ฝัง
- เผยแพร่เมื่อ 4 ต.ค. 2024
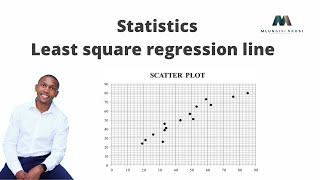
- In this lesson, you will learn how to write the equation of the line of best fit. This is an area of math where we study data and data analysis to understand trends in the data. In statistics, we often try to fit a line through the data points. Once we determine the line through the data, we can use that line of best fit to make predictions about additional data points nearby to the original sample data.
View more at: www.MathAndScience.com


Your facial expression and the actions alone blow the fear of mathematics away...you are a blessing
I haven't taken stats in 10 years. Thank you for the videos!
Thank you so much for your support incredible teacher!!!
You're very welcome!
Professor I do love maths, physics and chemistry even sciences and I wish you were in Florida to teach all of that incredible professor!!!
Mr. Jayson, please make a video on how we can strategically calculate the equation of the best fit without estimation and speculation but with pure mathematical approach!
I was the most sought after tutor in my college. Some people should be in teaching. Sadly, I couldn't go along with the ridiculous qualifications and besides, if I were to get into the school system surrounded by a bunch of goons, making a ton of money off the taxpayers for the part-time gig, I'd be campaigning to get the pay knocked down. I did offer to two school districts, being available for when teachers fail and at 2/3 the going rate but never got a reply.
I attest you to be an excellent teacher. I analyze enough to know this well.
My man teachin' math. Good for you bud.
Great teacher! ! ! Very enthusiastic person.
Thank you!
Brilliant explanation.
Thankyou sir. Amazing lesson thankyou
More please!! Would love some lessons from you on accounting and finance and company valuations… combined with programming, or even some crazy combo on all of that with ridiculous math only you seem to have competency to teach!
Thanks so much. Good suggestions!
Thank you 💗👑 happy Friday dear teacher 🤗🙏😘
So so so precise, I love it,
Really appreciate it!
THANK YOU... SIR...!!!
I haven't fully got, how to calculate. Yet, I got some idea.
My question is :
Could we calculate the number of stars in the sky with this kind of data equations... If we have a telescope...!!!???
( understanding that SPACE is VAST... beyond our visible limit ).
THANKS AGAIN...!!!
I'd like to ask: While eye-balling it, why don't we start at the ORIGIN and then choose a line of best fit?
In your very first example at about 06:00, your red line just randomly intersects the Y-axis at 2, and then at 18:30 it randomly intersects the X-axis at 1?
Nice
Thanks
Nice 👍
Thanks ✌
y = mx + c