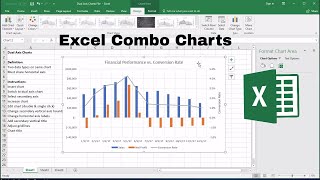
MS Excel - Combining Two Graphs Into One! Cool Trick!

ฝัง
- เผยแพร่เมื่อ 12 ก.ย. 2024
- To get your FREE Tableau Beginner Training course, check out my website at:
www.udemy.com/...
-----------------------------------------------
SUBSCRIBE for new videos Tuesday-Thursday. Click the notification bell so you don't miss a single episode.
GOT A QUESTION/PROBLEM? Why not request a video using the Comments section below. I'll make a custom video just for you.
----------------
VIDEO DESCRIPTION:
Working with graphs in Excel can be very fun. However, it never hurts to learn a few tricks along the way. In this video I'll show you how to quickly combine or move one graph into another! A great Excel trick!
----------------
Want to upskill to the next level of Tableau? Consider learning Tableau!
TRAINING COURSES:
Udemy - Complete Tableau Training Course
-Over 184k students and over 13k reviews!
-200 Lectures and 22 hours of Tableau Content
www.udemy.com/...
SkillShare Tableau Training
www.skillshare...
------------------------------------------------------------------
TH-cam PLAYLISTS:
Tableau for Beginners - A Quick Start TH-cam Course
• Tableau for Beginners ...
Tableau Desktop Accelerator TH-cam Course - A Beginners Guide for New Users
• Tableau Desktop Accele...
Tableau Online/Server Short Course - Site Creation, User Management and Licensing
• Tableau Online/Server ...
Tableau Online/Server - Complete Playlist
• Tableau Online/Server ...
Tableau Desktop - Complete Playlist
• Tableau Desktop - Comp...
Tableau Prep - Complete Playlist
• Tableau Prep - Complet...
#Tableau
------------------------------------------------------------------------------
RECORDING EQUIPMENT (Amazon Affiliate Program) -
VIDEO DESCRIBING EACH ( • My Recording Equipment... )
Headset: Sennheiser GSP 350 - Dolby 7.1 Surround, Noise Canceling, headset volume control
amzn.to/32N8vpz
Keyboard 1: Logitech Illuminated K830 Wireless Keyboard with Touchpad
amzn.to/2IIcHzn
Keyboard 2: Logitech MX Wireless Illuminated Keyboard
amzn.to/36BAIk4
Mouse: Logitech MX Master 2S
amzn.to/32KMaso (My current model)
amzn.to/2IF5C2G (Latest Model MX Master 3)
Laptop Stand: Adjustable/Tilting Laptop Stand Aluminum
amzn.to/2Uuj7F7
Monitor: BenQ 1080P 24-Inch Monitor
amzn.to/2Usen2T
Webcam: Logitech C920 HD Webcam 1080P
amzn.to/3kz7Ca3
LED Studio Lights: x2 Neewar 660 LED Video Lights with Barn Doors, Stand, Bag and Dimmer
amzn.to/3f3tuJr
Camera Tripod: Manfrotto Advanced Tripod 3-Way Head with Quick Release
amzn.to/3pvmg5V


You saved me like 180 minutes of work and tinkering, thank you!
th-cam.com/video/uNsVW9HWoC4/w-d-xo.html
I was searching for something like this through many useless youtube videos, this is so easy and amazing, thanks!
Only works if data is the same type. (numbers in this case) How do you combine two graphs if one data set is a general number and the other is a percentage? Doing this method just gives a flat line at the bottom representing percentages. How do you do that?
OH MY GOODNESS WHERE HAVE YOU BEEN. Thank you so much, I have been spending so much unnecessary time doing it with the "add data" function!
Hahahahaha you just described my whole tableau experience lols. Personally after all these years I still pick up a few tricks from time to time
I've just spent a whole 2 hours tinkering with this - you're a legend - thank you!
Hahaha!! Awesome!!!
Thank you so much for sharing this man. I was literally just about to leave the project in frustration, due to the time-consuming process of data selection. Just at the right time!
Thats awesome. Whats the project?
@@jellymaneducation6168 I’m doing an important presentation for my college and I needed to somehow combine data and therefore make one graph out of 6 different graphs. It ended up great and thanks to your video I didn’t have to waste much time on the matter:)
You are the hero of my Master thesis thank you so much
Brilliant thanks! That was so easy I’m glad we saw this !
Hi Fun Timez UK, just letting you know I've finally gone live with my new website and have a Tableau FREE course now available at the following link for you to enjoy.
jellyman-education.thinkific.com/courses/getting-started-with-tableau
Thanks for this video it helped me prepare superimposed graph for the master curriculum 🙂
That's awesome Ghostfreak!
Subscribed just because of this video, let's see what other tricks there are that two hours of googling doesn't bring up that maybe you will!
SUPER LIKE! YOU SAVED MY ASSIGNMENT
Outstanding trick; your friend and you are generous! Thanks very much!
th-cam.com/video/uNsVW9HWoC4/w-d-xo.html
Great video! But I have a question: how do you add the two Y-axis on both the left and right AND also add the y-axis labels?
the longest copy paste tutorial i've seen lmao!!
much appreciated tho!
you just saved me so much time. thank you!
Hi Jeremy, just letting you know I've finally gone live with my new website and have a Tableau FREE course now available at the following link for you to enjoy.
jellyman-education.thinkific.com/courses/getting-started-with-tableau
That was so cool and easy.. Thanks for sharing.
You are a life saver.. Thank you
th-cam.com/video/uNsVW9HWoC4/w-d-xo.html
Thank you so much sir!
Super!! Thank you for sharing!
Hi, just letting you know I've finally gone live with my new website and have a Tableau FREE course now available at the following link for you to enjoy.
jellyman-education.thinkific.com/courses/getting-started-with-tableau
WOW! WOW! WOW. Thanks a ton
🤯 likewise, always something new to learn.
Thank you! that is super helpful
Thanks Maria :)
Thank you so much for sharing this!
thank you very much!!
How to do this if x-axis of second plot is also different.
Udemy & youtube fantastic!!
Thanks Freddie! Btw, I have a FREE Tableau course now available on my website if you're interested!
jellyman-education.thinkific.com/courses/getting-started-with-tableau
YOU SAVED ME THANK YOU 😭🤝🤝
THANK YOU!!
Thanks Dhiar
Thank you, you saved me hours
Thank you
What is one column of values are in number format and values in another column are in percentage format?? Please reply. Thanks
I tried this with two boxplot graphs in excel 2013 and the values of the pasted boxplot where modified in the final graph. How can I correct this?
Like really duuudeee !!! 😱😱😱😱😱
Thanks a lot
Thanks Aaryan!!!!!!!!!!!!!! :) :) :) :)
Damn bro, if only I had known this in college.
Sa-ti dea Dumnezeu sanatate.
Hi Marian, just letting you know I've finally gone live with my new website and have a Tableau FREE course now available at the following link for you to enjoy.
jellyman-education.thinkific.com/courses/getting-started-with-tableau
0:50 I have a very big (13000 lines) data; selecting this way isnt practical for me. Any way of selecting it?
Could you please show me the pyramid graphs?
Thank you, I got tired trying figure it out
I cant seem to get this to work. Im trying to over lay consultations per month with revenue per month. no matter what it always shows back up with one line. please help!!!!
Back me my two minutes which are wasted watching this
hell that works
Hi, I couldn't make it work for two bar graphs!
HOW DO YOU GIVE THEM DIFFERENT AXIS!!!!!!!
God bless you😭
cool!
Hi Erfan, just letting you know I've finally gone live with my new website and have a Tableau FREE course now available at the following link for you to enjoy.
jellyman-education.thinkific.com/courses/getting-started-with-tableau
Doesn't worl with box plots
Doesn’t work on mines
Unfortunatelly, it would seem that doing this crashes my Excel. I'll just have to tell my boss that no can do. 5 million data points are too much.
Thanks, but you could have just skipped the first 1 min 30 s of the video. Because how to create a graph is not the topic :).
-40% for not including Legends and not showing me how to transfer over legends
This guy has hacked excel!