Using Summary tables from ANOVA output to create a bar graph with custom error bars

ฝัง
- เผยแพร่เมื่อ 15 ก.ค. 2024
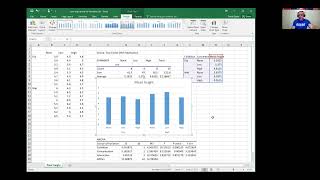
- Illustrates how to perform a 2-factor ANOVA in Microsoft Excel, and how to use the output from the Summary tables to make a graph, including custom error bars. The video cuts off at 10 minutes, while I am demonstrating how to make custom error bars for the second series of data (the orange bars). Simply follow the same steps I demonstrate for the first series (the blue bars). For instructions on how to interpret the p-values, see • How to interpret p-val...


thankk you so much.. this has solved my final year thesis problem...grateful
You are amazing! i forgot how to do standard error and it was driving me crazy, Thank you!
Hi amy can i use your help . This video is really helpful
And can you tell if I have 1 control , 3 experimental group and can i use this type ANOVA or I have to use some other type ANOVA?
Please if you explain it to me it will also be helpful in may research.
Thank you again😊
If you only have one independent variable, I think you will want to use a 1-way or single-factor ANOVA.
@@amydykstra ok thank you i will try on it.