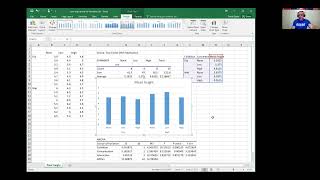
How To... Perform a Two-Way ANOVA in Excel 2013

ฝัง
- เผยแพร่เมื่อ 25 ส.ค. 2024
- Learn how to perform a two-way analysis of variance in Excel (version 2013). Use two-way ANOVA when you have one measurement variable and two nominal variables. Also know as Factorial Analysis of Variance.


You, my dear man, are a lifesaver. I easily spent an hour trying to figure this out on my own and I imagine I would have spent far more time if I didn't find your video.
Gentlemen and a scholar, was literally wasting an hour and you fixed my problem in 2 minutes
I've been finding these videos very helpful. The combination of logic explained and then how to process it in Excel it particularly good. Thank you!
Ay man i love you! I have watched your Chi square tutortial before during my bachelor in environemental sciences. And now im writting a bachelor in biology! Irish accent is also very charming
THANK YOU!!! I now fully understand how to do two way anova and to interpret. I can finally start my scientific paper!
I am currently completing a scientific project for my dissertation which will be submitted by the end of August this year! I honestly did not understand one-way or two-way ANOVA from the explanations that were given to us and after watching this I did it with ease! A massive thank you - I cannot explain how much help this has been :)
Glad to be of help!
Same here! This video has saved me, thank you!
Thank you so much, mister Eugene. I hope you have a happy life
Finally found a video that explained Two-Way ANOVA thoroughly. Thank you!
Thank you - I just added the data analysis to excel - that's going to save me time!
Excelent way of explaining! I've been trying to understand how two-way anova works and this did it for me. Thanks a lot!
Brilliant! Thank you so much. More of my stats anxiety melting away right when I needed it to.
You are a hero in 2020.
Better i should learn the things from you sir, its a very very use full for me... plz keep uploading like these videos.
I found this video very, very, very useful. Thank you. I'm tempted to type more 'very's 🤩
Excellent explanation! While not ideal, I was taught that Anova is still quite robust despite unequal group numbers.
Thank you soooooo much for this video!!!! ❤🎉
Eugene, thank you. You have saved my group a ton of headache from explaining the statistical significance of the interaction.
Thank you professor, I find this video is very easy to follow and understand!
It's been awhile since I took stats, this helped a billion! Thanks.
thank youuu, this really helped with my thesis❤❤
Fantastic video. One of the best out there. Thank you.
Thank you!
Incredibly helpful video, well explained and reasoning behind statistical test was great!
Thank you for your information sir!
My pleasure
Thank you very much for your perfect explanation!
Thank you so much for sharing sir. Very helpful indeed! This helped me a lot especially on the interpretation of results.
extremely helpful!!! thank you, saved my team's group project!
Thank you! Very clear explanation!
yo thanks man, just saved my ass on a final
Very informative and clear, concise explanation.
Thank you so much. It's been a year and a half since I had done this and I had completely forgotten how to orient the table.
thank you
saved my ass on solving for statistics, thank you for this!
Thank you, very clear presentation
Thanks Dr. Eugene it helped a lot
Very helpful! Thank you.
Very very helpful! Thank you so much!
Thank you so so much
super helpful! Thanks a lot!
Amazing explanation, thank you so much!
Thank you very much. It's really helpful😍
Many thanks
Very helpful. Thanks!
i found this video useful. Thank You kind Sir.
Super helpful! Thank you so much!
👍👍👍 ! ! ! Super Duper AWESOME!
Thanks, excellent instruction
very helpful, thanks sooo much
I Dr. I ran the Two Way Anova with replication but, I got an output with a = #NUM! and p-value = #NUM!. I also imported the data into spss. The result came out without interaction. What can I do in this case Sir?
I have selected all variables and labels but error show of input range contains non numeric data...
Thanks sir, very clear explanation.
Thanks for the video! Quick Question:
How do I interpret the result if F is greater than F-crit, but the p-value is very high (~0,4)?
Thanks!
Hi TechByte,
You should not get both together - please recheck your calculations. An F stat greater than F crit means that you reject the Null Hypothesis, and p-value greater than alpha means that you cannot reject the Null Hypothesis.
Hope this helps,
Dr E.
@@EugeneOLoughlin thanks for the reply Dr. E! Really appreciate it :)
I’ve since found the mistake: I had a typo in my alpha value. It was set to 0,5 instead of 0,05 🤦♂️
Still interesting though, that the p-value and F statistic can contradict each other when you have a large alpha!
By the way, are there any other follow up tests you can recommend if none of your null hypotheses can be rejected? My p-values are 0,478, 0,435 and 0,078 respectively, so there are no statistically significant effects or interactions at a level of alpha = 0,05.
Thank you, and have a nice day!
Sir,it's indeed helpful.Many Thanks from India. Could you please make another video of w/o replication as well?
VERY HELPFUL
What if you have uneven rows in a sample
Many thanks sir.. that is really helpful
Sir whenever i apply 2 way anova with replication it is showing that input range consist of non-numeric data....what shoukd i do?
good teacher
Thank you a LOT!!!
Sir, please enlighten me about what you said in 5:40 minutes. You said the p-value (5.4E-08) is tiny which means, reject the null hypothesis. I am confused, how can it be tiny compared to the 0.05 alpha value? I will discuss this topic, and your video greatly helps me. Only that, I am confused about this part. Thank you.
I'm enlightened already sir. This might help others who have the same confusion with 5.4E-08. At first, I assumed this was greater than the alpha value 0.05. I asked the help of ChatGPT and here is the explanation: The notation "5.43985E-08" is a representation of a number in scientific notation. It's a way to express very large or very small numbers in a compact form.
In scientific notation, a number is expressed as a coefficient multiplied by a power of 10. The "E" stands for "exponent," and it tells you how many places to move the decimal point.
So, "5.43985E-08" means 5.43985×10 −8 , which is equivalent to 0.0000000543985. Indeed, this is very tiny compared to the 0.05. Hope this helps.
very helpful and easy
Thank you sir
THANK YOU
What can I do in Excel if I have some null values and unequal sample sizes?
thank you!!!!
what if your rows are not the same? Iv been given a set of data points, that are equivalent in number
Thank you!!
What can do if your rows of your sample are uneven? That is that some in one factor there is 16 data point and another there is 23
Hi Kyla,
This will not work in Excel - you could use another tool such as SPSS or R.
Dr E.
Sir I have a dependent variable i.e accident count in form of numbers and multiple independent variables i.e different land use in form of areas , please suggest which statistical analysis can be used.
I have these data for 7 different areas .
Do i need to compare the datas to the initial value?
good morning sir. how can we determine which of the brand was better? is it the best or super?
Sir can we perform 2 way anova with more than one observation per cell in Excel
Hi Eugene. Thank you for all "How to..." videos, are REALLY helping me. One quick question: the TWO WAY ANOVA test can be performed by hand also rather than performed in Excel? Thank you
Hi Alexandra,
First - many thanks for your kind comment.
The 2 x ANOVA, and all other ANOVA tests, can of course be done by hand. But it is a lot more complicated then the 1 x ANOVA. I don't cover it in my classes - I just use Excel (plus SPSS and R) to perform the two-way ANOVA.
Dr E.
Thank you, helped me a lot. One question - in case the number of row is not the same - I need to use ANOVA without replication?
Man I have the same issue. Did you get the answer?
@@junaidgamedev it cannot be done in excel.. someone helped me with another software, i dont remember the name, sorry.
Hi Eugene, is it the case that what Excel understands by "with replication" is what is traditionally known as "between subjects"? In other words, is the analysis you explain here suitable if the different rows in each category represent different individuals (cases), and the category is a type of individual, e.g. instead of the Super and Best brands with its 4 rows each, we had Men and Women categories, each with 4 subjects? many thanks!
My understanding is that 'between subjects' means each person gets only 1 treatment while 'within subjects' can be where the same person gets more than 1 treatment. I don't have my statistics book with me but the tricky part is whether the number of subjects for each treatment has to be the same. Here, it seems to be yes.
What do we do if we do not have the same number of data in each row? Thank you!
Hi Mayar,
Unfortunately Excel 2013 does allow for uneven data - it will not work. Don't be tempted to insert zeros or other data, as this will mess with your results. You may need to work out by hand/manually, or use another tool such as SPSS.
Dr E.
Always shows that input range has non-numeric data. I'm really frustrated now
Hi Joshua,
This error is usually due to one of two things. First - if you have any non-numeric data in your data table, like a character or date, this will not work with any ANOVA tool. So the obvious first check is to remove any non-numeric data. But the second, and most common, reason is that you do not have the same number of values in each cell. In my example in the video there are four values in each cell: eg, four Cold values for the Super brand, four Warm values for the Super brand, and so on. In Excel you MUSThave the same number of values in each row - in my video at 2:35 I enter the number 4 in the "Rows per sample" box. So if you have three values in one cell, and four in the rest - Excel will not work. This is a quirk of Excel - other tools such as SPSS can handle this.
Hope this helps,
Dr E.
@@EugeneOLoughlin I checked so many times and it really is not working. The only thing I can notice on the sheet Im working on is that every number is in 2 decimal places (e.g. 14.20). The headings are non numeric but it worked for you when youused the ANOVA function on the table you have in the video.
I also rechecked and it has equal number of rows per sample. I don't really know now whats wrong with excel
Hi Joshua,
Two decimal places should not matter.
Double check that all your data are formatted as numeric, and that you have laid it out on the spread sheet in the way my data are at the beginning of the video. Make sure that you do not have any blank cells. Otherwise I cannot tell why this is not working for you.
Dr E.
@@EugeneOLoughlin Thank you! It works now - seems excel just wanted me to redo the data at a new sheet. thanks again!
@@joshuas.geraldino1202 :-)
You have not specified that which 2 are different
It is done by finding Critical difference and Mod(T1-T2)
T1 and T2 are averages of brands
Please make a separate video for this problem.
Sir, if the number of rows are not same and even the number of samples are also not same in each sector then how to run this ANOVA
Hi Nankishor,
You cannot do this in Excel - use another tool like Minitab, EPSS, R, etc.
Dr E.
Many Thanks
Thanks that was very helpful :)
Thank you!
thank you
thank you