G'day lads, if you want access to this model (and every other Excel LADZ model), join the Excel LADZ community! Sign up here: www.patreon.com/ExcelLADZ 💪
Table as shown in the video is not in the site.. there are tables for different stats and one team may have more stats than the other in the main league table making it hard to transform the table.. kindly share the exact link
Thanks lad 💪💪💪. The inspiration for this video was actually from a subscriber in my last 'World Cup' video. So, if you have any suggestions please don't hesitate to write them in the comments lad.
You need to use independent criteria such as shots on goal or possession and different information that will not correlate with each other then your model will be good and suitable for analysis it's like if you use in place of possession as you show in your model you would use let's say points then your correlation model your model that makes predictions would be 99% successful but on the new parameters it was showing very bad results.
I too have been doing regression analysis for a long time and analyze soccer by different criteria to do an analysis based only on ball possession is not practical to use several parameters and try to avoid multicollinearity so the model for normal results should include the most appropriate criteria Correlation
G’day lad, you’re totally right 🔥 This video was more for beginners to understand the process of using linear regression to estimate an output based off of an input 👍
Great video! You think about making a video about automatising a couple of things on excel? And second idea: what about a relative attack / defense strength rating of 2 teams. Go on with the good work. I‘m in!
Hi lad, your relative Attack/Defense Strength Rating Model is exactly what I’m looking to publish within the next couple of weeks 🔥 Make sure you’re subscribed to catch this lad 💪
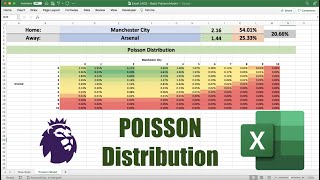
Hi lad, yes there is 🔥 The average goals is basically a scale to adjust a team's xG for the match. Let's take an example of Everton vs Manchester City. Man City has an ATT Rating of 2, meaning they score goals 2x more than average in the league. Everton has a DEF Rating of 1, meaning they concede an average amount of goals in the league. Multiplying these two together, Man City will be expected to score 2*1 = 2 times more than the league average in their game against Everton. If the league average goals were 2, than Man City would be expected to score 4. If it was 0.5, then they would be expected to score 1 👍 Vice versa for Everton's xG: Everton ATT * Man City DEF * League Average Goals
You do the analysis on the tables of past matches where all the games in the league have already been played and also compare then two teams from the same table from the same league with each other and you show how it will work on the new data that have not played 38 matches played only six or five show how it will work
Another great learning exercise I'll mess about with it to see if I can get it to work for horse racing. Perhaps you know or have heard of my nephew he's a retired Prof who taught statistics at an Aussie University lives in Tasmania now
No, sorry lad. Just try and have a watch through the video and copy the steps shown. If you run into a problem, just chuck a comment and I’ll comment as fast as I can.
hey mate, I get the idea behind taking the att rating and multiply the opposition's def rating. But is there like a mathematical reason behind it and by I should multiply instead of, perhaps, subtracting them Cheers
Awesome video! I have a question though! What’s the difference when you do the “What ifs” in the simulation rather than just copying the binom.inv down to the bottom for the 10k simulations?
Hi lad, thanks for watching the video 🔥 In this particular model, there is no difference between the ‘What If’ and copying down the 10k simulations. The reason why I wanted to include it in this model is because ‘What If’ analysis is a really valuable tool to have when running simulations that have multiple formulas and calculations. For example, using a linear regression model to simulate an entire league table using the Binom.INV function, then simulating that whole season itself 10,000 times (which only ‘What If’ has the power to do). I’m hoping this explanation helps lad, sorry if I’ve caused some confusion with doing the What If rather than copying down the Binom.INV function 👍
Hi lad, the stronger the correlation, the more accurate & reliable the model will be. While a model with a weak correlation could still produce a predicted result, it would be less reliable 👍
@@excel_ladz Thank you for the respond. I've also watched your video about prediction of world cup using probability and elo rating. I've enjoyed that video a lot. Can you suggest me ways to construct a probability with possession-related system? I've calculated the correlation but it shows moderately weak. My teacher don't really encourage making a model just as you mention but instead make a probability. Your help would be really appreciated. Thank you!
Heyy Lad, I'm new to the channel and I would like to know how you actually imported data from FBREF to your excel because It seems I have to combine different rows and columns from the site to come up with an excel sheet like yours.
Hi lad, yes unfortunately I’ve had to do that. However, newer versions of Excel can allow you to do this, while still using a Power Query to make the data update automatically 🔥 First you would have to make two separate queries; one for the normal table with the goal difference, points and etc, while the other query would have the possession data. Then in Power Query Editor, you can merge these two queries (as long as one column is constant or common between the two tables, which is the teams list). This will become a new query in which the data can update by itself 👍
Hi lad, thanks for watching 💪 The data on the EPL Data worksheet is from Football Reference where I’ve gotten the stats from the EPL Squad Possession table there. In the Simulations worksheet, the data table created is just 10,000 simulations of the scorelines based on xG (Expected Goals). This is from S11:S12 on the EPL Data worksheet. Now, these simulations you can create totally by yourself using the formula outlined in the video. I hope all goes well lad 👍
Hi, I'm trying to use linear regression to compare the predicted scores and winner of the World Cup vs. the actual outcome for a maths assessment. Since you used the Premier League here as an example, I was wondering if there would be any differences when calculating for the WC, if there are significant differences. Thank you in advance!
Hi Sara, I have a video predicting the World Cup on my channel but it does not use linear regression. You could use linear regression in predicting the World Cup, but there is a lack of data available compared to the Premier League. This is because national teams do not play a lot of matches relative to English Premier League teams, meaning the dataset is smaller and perhaps less reliable. Please subscribe for more content like this 👍
Hi lad, you could do this by converting the percentages to 'intrinsic' odds. For example, a Man City Win outcome with a likelihood of 50% should be fairly priced at $2.00. If any price above that is offered, the bet should be theoretically taken to maximise expected value. However, the model is obviously not perfect. The closer your R squared value is to 1, the more powerful the model becomes.
Hello. On the video where start at 2:55 i did everything, but i got message "regression - the input range contains non-numeric data." ? How is it possible? I did everything what you did, i tried to search on youtube how to solve the problem but i didnt find. If you can please help please. Thank you very much @Excel LADZ
Hi lad, thank you for watching 🔥If the input range contains "non-numeric data", then you must have your numbers formatted as text rather than actual numbers. You'll see that the range I've highlighted for the 'Input X Range:' at 2:53 has numbers on the right hand side of the cells. 67.9, 62.7, 61.8 etc are all on the right-hand side of the cell; this means it is formatted in numeric form. In your case, it is most likely that your numbers are on the left-hand side of the cells, and instead formatted in text form. You need to convert these numbers into numeric form, and you'll know it's successful when the numbers are on the right-hand side of the cells. One solution to fix this is to wrap the numbers in the VALUE function in Excel... Let me know how you go lad 👍
@@excel_ladz Thank you for answer, but i have one more problem. At 9:17 =xlookup(P7,teams,$k$2:$k$21) and i get message: It is some problem with the formula try etc etc" why? I did everything the same way you did from the start on the video, i followed every second you did. But for some reason it not working. :( Help please thank you
Hello sir, I was able to do a replica with Excel 2016 without the SEQUENCE function. It appears my final output looks somewhat inverted. I'd love to email you my version for possible debug. Thanks
Hi lad, I’d love to help 💪 If you’re interested in joining the Excel LADZ Discord, where I and others will help you with your sports models, have a look at the link below 👇 A copy of the model adjusted for Excel 2016 users and later is also available for instant download 🔥 Check it out here: www.patreon.com/ExcelLADZ
Hi lad, thanks for being a loyal follower of the channel. This data (from the 2021 English Premier League season) has been copied from the website Football Reference. The link to the stats is in the description of the video 👆👆👆 .
What does it mean to have the F value at 19.6 and the Significance F at 0.000322753 (Att Correlation) is it okey to have it that low ? You have the significance F at 2.604E -06. And how do you make sequences without Excel 365/2021 ? Cant add sequences in other excels I asume ?
G’day lad, thanks for commenting. If you haven’t already, please consider subscribing to the channel! To your question though, any significance F below 0.05 is considered fine and acceptable to be used in a predicative model. In regards to creating sequences without the most recent version of Office, just type in 1, then 2 below it, then 3 below that cell. Then highlight this range and drag down for 1,000 cells (or rows) and it will create a sequence from 1-1000. Let me know if you have any more questions lad.
G'day lad, obviously it's much tougher estimating the attacking and defending strength of a newly promoted/relegated club when they haven't played any games in the competition yet. One strategy would be to gather data on the success of teams that are relegated/promoted in the past few years, based off of their points before getting promoted/relegated. Then you could apply those ratings to the new clubs. It's a really interesting topic for me personally, so I plan to release a video on this before the new Premier League season starts.
Hello sorry to bother you but I'm trying to do the same thing for a college homework and I don't get the same result with the same value and the analysis that you do don't get me the same outcome (no p value for example). Can this be related to the fact that I did this on Windows. Before I do the analysis the windows doesn't give me more option.
Hi lad, no bother at all! I love answering questions for subscribers and viewers 👍. First of all, I don't think you doing the regression on Windows had anything to do with your error. Make sure when you input the x and y ranges for the linear regression they are correct for your data. If you are copying my data, then enter the formulas in exactly how I've done it in the video. If your problem is the linear regression tab doesn't even appear, then make sure you have the feature installed within your Excel 'Data' tab by enabling it in settings. If you still have problems, comment again lad. The more specific the better my answer will be 💪 .
Thanks for watching and commenting lad. As to your question, I'm not quite sure what you mean. Are you suggesting a stem and leaf plot held in cell K2?
G'day lad, thanks for watching! Make sure you're subscribed to be come a lad 💪. As to your question, the R-Squared value in this model is only 0.71 (as explained at around 3:33 of the video) . An R-Squared value of 1 means that all predictions are identical to the observed values. Meaning, the closer you get to 1, the more accurate your model will be. Usually an R-Squared ratio of above 0.90 is considered to be good or a "reliable indicator", meaning that this model (due to its lower R-Squared rating) could potentially lead to inaccurate predictions at a more frequent rate than a model with a higher R-Squared ratio.
Factors that increasingly successfully predict the outcome you are measuring by will score higher R squared values. For example, when predicting whether a team will win a match, factors such as possession, shots on target or dangerous passes will lead to higher R squared values (and thus higher confidence in the model) than a stat such as yellow cards. Sorry for the late reply lad, for some reason I don’t get notifications when people reply to an existing comment 😞. Follow me on my Twitter page: @excel_ladz 🔥
HI lad, make sure to subscribe if you enjoyed the video! The POSS that comes into my worksheet is the average level of possession that team had scored throughout the 2021 English Premier League season. I then use this stat to predict the outcome of matchups between these teams, assuming there is a correlation between a team's performance and their level of possession.


G'day lads, if you want access to this model (and every other Excel LADZ model), join the Excel LADZ community! Sign up here: www.patreon.com/ExcelLADZ 💪
Download excel ?
@@jurajpodmanicky6382 Yes, signing up will give you downloadable access to this spreadsheet 👍
@@excel_ladz download complete program possesion distribution
@@jurajpodmanicky6382 hey, please i'm finding it difficult to download the spreadsheet, do you mind sharing?
Table as shown in the video is not in the site.. there are tables for different stats and one team may have more stats than the other in the main league table making it hard to transform the table.. kindly share the exact link
You're doing great. You deserve thousands of subscribers and soon you'll be there
Thanks lad 💪💪💪. The inspiration for this video was actually from a subscriber in my last 'World Cup' video. So, if you have any suggestions please don't hesitate to write them in the comments lad.
Your video saves huge time in quality work ❤
wow new knowledge i can't wait to do this, u will have thousands of subscribers for this great job of yours keep on!
Thanks lad, I’m very happy you took value out of the video 💪.
You need to use independent criteria such as shots on goal or possession and different information that will not correlate with each other then your model will be good and suitable for analysis it's like if you use in place of possession as you show in your model you would use let's say points then your correlation model your model that makes predictions would be 99% successful but on the new parameters it was showing very bad results.
I too have been doing regression analysis for a long time and analyze soccer by different criteria to do an analysis based only on ball possession is not practical to use several parameters and try to avoid multicollinearity so the model for normal results should include the most appropriate criteria Correlation
G’day lad, you’re totally right 🔥 This video was more for beginners to understand the process of using linear regression to estimate an output based off of an input 👍
You're the GOAT man
Great video! You think about making a video about automatising a couple of things on excel? And second idea: what about a relative attack / defense strength rating of 2 teams. Go on with the good work. I‘m in!
Hi lad, your relative Attack/Defense Strength Rating Model is exactly what I’m looking to publish within the next couple of weeks 🔥 Make sure you’re subscribed to catch this lad 💪
hi lad, I have to ask.
In order to find the xG according to your vid, is there a reason to multiply with the average goals?
Hi lad, yes there is 🔥 The average goals is basically a scale to adjust a team's xG for the match. Let's take an example of Everton vs Manchester City. Man City has an ATT Rating of 2, meaning they score goals 2x more than average in the league. Everton has a DEF Rating of 1, meaning they concede an average amount of goals in the league. Multiplying these two together, Man City will be expected to score 2*1 = 2 times more than the league average in their game against Everton. If the league average goals were 2, than Man City would be expected to score 4. If it was 0.5, then they would be expected to score 1 👍 Vice versa for Everton's xG: Everton ATT * Man City DEF * League Average Goals
You do the analysis on the tables of past matches where all the games in the league have already been played and also compare then two teams from the same table from the same league with each other and you show how it will work on the new data that have not played 38 matches played only six or five show how it will work
Another great learning exercise I'll mess about with it to see if I can get it to work for horse racing. Perhaps you know or have heard of my nephew he's a retired Prof who taught statistics at an Aussie University lives in Tasmania now
Thanks for watching lad 👍. Unfortunately I don’t think I’ve had the privilege of meeting your nephew.
I see that your model came from a completed season of 38 matches. So, for the subsequent new EPL season, we just make our picks on any two teams?
Banger content mate, keep it up!
Thanks lad, make sure to subscribe if you haven’t already!
@@excel_ladz of course lad
That's good work. can you make the spreadsheet available?
No, sorry lad. Just try and have a watch through the video and copy the steps shown. If you run into a problem, just chuck a comment and I’ll comment as fast as I can.
Pls make a video on how to predict ball possession using attacking and defensive strength.
hey mate, I get the idea behind taking the att rating and multiply the opposition's def rating. But is there like a mathematical reason behind it and by I should multiply instead of, perhaps, subtracting them
Cheers
Awesome video! I have a question though! What’s the difference when you do the “What ifs” in the simulation rather than just copying the binom.inv down to the bottom for the 10k simulations?
Hi lad, thanks for watching the video 🔥 In this particular model, there is no difference between the ‘What If’ and copying down the 10k simulations.
The reason why I wanted to include it in this model is because ‘What If’ analysis is a really valuable tool to have when running simulations that have multiple formulas and calculations. For example, using a linear regression model to simulate an entire league table using the Binom.INV function, then simulating that whole season itself 10,000 times (which only ‘What If’ has the power to do).
I’m hoping this explanation helps lad, sorry if I’ve caused some confusion with doing the What If rather than copying down the Binom.INV function 👍
@@excel_ladz no worries it’s a great explanation. I’ve always wanted to do simulations like this but have never had the skills or knowledge so thanks.
Hello, would this model still work let's say if the correlations is weak? Great video btw!
Hi lad, the stronger the correlation, the more accurate & reliable the model will be. While a model with a weak correlation could still produce a predicted result, it would be less reliable 👍
@@excel_ladz Thank you for the respond. I've also watched your video about prediction of world cup using probability and elo rating. I've enjoyed that video a lot. Can you suggest me ways to construct a probability with possession-related system? I've calculated the correlation but it shows moderately weak. My teacher don't really encourage making a model just as you mention but instead make a probability. Your help would be really appreciated. Thank you!
Heyy Lad, I'm new to the channel and I would like to know how you actually imported data from FBREF to your excel because It seems I have to combine different rows and columns from the site to come up with an excel sheet like yours.
Hi lad, yes unfortunately I’ve had to do that. However, newer versions of Excel can allow you to do this, while still using a Power Query to make the data update automatically 🔥 First you would have to make two separate queries; one for the normal table with the goal difference, points and etc, while the other query would have the possession data. Then in Power Query Editor, you can merge these two queries (as long as one column is constant or common between the two tables, which is the teams list). This will become a new query in which the data can update by itself 👍
If I were to create this model for NHL, which stat would you suggest i use instead of possesions? Perhaps shots or shots on goal?
Yeah for sure lad 👍 Here’s a great website for pulling in these stats for the NHL: www.hockey-reference.com/leagues/NHL_2024_skaters-advanced.html
Sorry, I'm soooo lost. Is the data table to different tables combined or a custom table thats being pulled in? I can't see it on the FBREF site
Hi lad, thanks for watching 💪 The data on the EPL Data worksheet is from Football Reference where I’ve gotten the stats from the EPL Squad Possession table there. In the Simulations worksheet, the data table created is just 10,000 simulations of the scorelines based on xG (Expected Goals). This is from S11:S12 on the EPL Data worksheet. Now, these simulations you can create totally by yourself using the formula outlined in the video. I hope all goes well lad 👍
Regrasyon analizini her seferinden yapmak yerine x y
x*y
X^2
N. Bunlardan formül ile her ligi uyarlanabilir mantık olarak
Which sports book offers possession betting?
Hi, I'm trying to use linear regression to compare the predicted scores and winner of the World Cup vs. the actual outcome for a maths assessment. Since you used the Premier League here as an example, I was wondering if there would be any differences when calculating for the WC, if there are significant differences. Thank you in advance!
Hi Sara, I have a video predicting the World Cup on my channel but it does not use linear regression. You could use linear regression in predicting the World Cup, but there is a lack of data available compared to the Premier League. This is because national teams do not play a lot of matches relative to English Premier League teams, meaning the dataset is smaller and perhaps less reliable.
Please subscribe for more content like this 👍
Could be use a current (2023) possession chart?…Txz Lad!
Absolutely lad, as long as the dataset has around 20+ games, it should be accurate enough 👍 Thanks for watching!
Thank you
So do you use this strategy to bet on the new season
Hi lad, you could do this by converting the percentages to 'intrinsic' odds. For example, a Man City Win outcome with a likelihood of 50% should be fairly priced at $2.00. If any price above that is offered, the bet should be theoretically taken to maximise expected value. However, the model is obviously not perfect. The closer your R squared value is to 1, the more powerful the model becomes.
Hello is it possible to get this particular excel sheet template for personal fun work?
Hi lad, you can email me at ladz.excel@gmail.com where the Excel Sheet Template is available for a small price 🔥. I hope you enjoyed the video 💪
Hello friend, greetings. Could you do a video on corner prediction?
G'day lad, that sounds like a great idea 💡. In the short term, I'll see if I can upload that to the channel 💪
Hello. On the video where start at 2:55 i did everything, but i got message "regression - the input range contains non-numeric data." ? How is it possible? I did everything what you did, i tried to search on youtube how to solve the problem but i didnt find. If you can please help please. Thank you very much @Excel LADZ
Hi lad, thank you for watching 🔥If the input range contains "non-numeric data", then you must have your numbers formatted as text rather than actual numbers. You'll see that the range I've highlighted for the 'Input X Range:' at 2:53 has numbers on the right hand side of the cells. 67.9, 62.7, 61.8 etc are all on the right-hand side of the cell; this means it is formatted in numeric form.
In your case, it is most likely that your numbers are on the left-hand side of the cells, and instead formatted in text form. You need to convert these numbers into numeric form, and you'll know it's successful when the numbers are on the right-hand side of the cells. One solution to fix this is to wrap the numbers in the VALUE function in Excel...
Let me know how you go lad 👍
@@excel_ladz Thank you for answer, but i have one more problem. At 9:17 =xlookup(P7,teams,$k$2:$k$21) and i get message: It is some problem with the formula try etc etc" why? I did everything the same way you did from the start on the video, i followed every second you did. But for some reason it not working. :( Help please thank you
And i use windows, Excel 2016
Hello sir, I was able to do a replica with Excel 2016 without the SEQUENCE function. It appears my final output looks somewhat inverted. I'd love to email you my version for possible debug. Thanks
Hi lad, I’d love to help 💪 If you’re interested in joining the Excel LADZ Discord, where I and others will help you with your sports models, have a look at the link below 👇 A copy of the model adjusted for Excel 2016 users and later is also available for instant download 🔥 Check it out here: www.patreon.com/ExcelLADZ
Bu verileri nereden kopyalıyoruz
Hi lad, thanks for being a loyal follower of the channel. This data (from the 2021 English Premier League season) has been copied from the website Football Reference. The link to the stats is in the description of the video 👆👆👆 .
Bu verileri hangi siteden kopyalanyapıştır yaptık türk spor sitelerinde bu şekilde veri yok gamgi siteden öğrenebilirmiyim
Try the link in the description for the data lad.
What does it mean to have the F value at 19.6 and the Significance F at 0.000322753 (Att Correlation) is it okey to have it that low ? You have the significance F at 2.604E -06. And how do you make sequences without Excel 365/2021 ? Cant add sequences in other excels I asume ?
G’day lad, thanks for commenting. If you haven’t already, please consider subscribing to the channel! To your question though, any significance F below 0.05 is considered fine and acceptable to be used in a predicative model. In regards to creating sequences without the most recent version of Office, just type in 1, then 2 below it, then 3 below that cell. Then highlight this range and drag down for 1,000 cells (or rows) and it will create a sequence from 1-1000. Let me know if you have any more questions lad.
Aslında skor olarak da aratarak en yakın skor analizide yapılabilir sanırım
How does this work for Promoted/Relegated teams at the end of each season?
G'day lad, obviously it's much tougher estimating the attacking and defending strength of a newly promoted/relegated club when they haven't played any games in the competition yet. One strategy would be to gather data on the success of teams that are relegated/promoted in the past few years, based off of their points before getting promoted/relegated. Then you could apply those ratings to the new clubs. It's a really interesting topic for me personally, so I plan to release a video on this before the new Premier League season starts.
wow, thanks for to shared with us
Thanks for watching lad 💪
Hello sorry to bother you but I'm trying to do the same thing for a college homework and I don't get the same result with the same value and the analysis that you do don't get me the same outcome (no p value for example). Can this be related to the fact that I did this on Windows. Before I do the analysis the windows doesn't give me more option.
Hi lad, no bother at all! I love answering questions for subscribers and viewers 👍.
First of all, I don't think you doing the regression on Windows had anything to do with your error. Make sure when you input the x and y ranges for the linear regression they are correct for your data. If you are copying my data, then enter the formulas in exactly how I've done it in the video.
If your problem is the linear regression tab doesn't even appear, then make sure you have the feature installed within your Excel 'Data' tab by enabling it in settings.
If you still have problems, comment again lad. The more specific the better my answer will be 💪 .
@@excel_ladz Thanks a lot mate I'll try this out !
Great stuff 🎉
Thanks lad, I appreciate the support. Subscribe for more!
Nice One.
Pls can you help me with the Excel spreadsheet.
Thanks
Sure lad, what part of the video in particular are you having problems with?
La formula RAND() EN español que significa y
leaf EPL Data with this formula K2 Poss in one cell?
Thanks for watching and commenting lad. As to your question, I'm not quite sure what you mean. Are you suggesting a stem and leaf plot held in cell K2?
Türkiye den takipcinizim
Başarılar kazanan hep fotbal severler olsun bu excel dosyasını nasıl temin edebilirim
Hİ,I'm your follower from Turkey. How can I get this excel file?
Hi lad, you can reach out to me on my email: ladz.excel@gmail.com
Thanks for watching Excel Ladz 🔥
Great content. The more I do this the less I time I have left to lose.🤣
That's great news lad! Thank you for watching 👍
Merhaba bir konuda yardım istiyorum
Örnek
Liverpool takımının
(K)sütundaki 62.7
veri nasıl elde ediliyor
the teams with the highest percentage of ball possession won 295 (49.2%), draw 132 (22.0%), and lost 172 (28.7%)
what are the possible errors that will lead to inaccurate predictions?
G'day lad, thanks for watching! Make sure you're subscribed to be come a lad 💪.
As to your question, the R-Squared value in this model is only 0.71 (as explained at around 3:33 of the video) . An R-Squared value of 1 means that all predictions are identical to the observed values. Meaning, the closer you get to 1, the more accurate your model will be. Usually an R-Squared ratio of above 0.90 is considered to be good or a "reliable indicator", meaning that this model (due to its lower R-Squared rating) could potentially lead to inaccurate predictions at a more frequent rate than a model with a higher R-Squared ratio.
@@excel_ladz what factors determine R-squared accuracy?
Factors that increasingly successfully predict the outcome you are measuring by will score higher R squared values. For example, when predicting whether a team will win a match, factors such as possession, shots on target or dangerous passes will lead to higher R squared values (and thus higher confidence in the model) than a stat such as yellow cards.
Sorry for the late reply lad, for some reason I don’t get notifications when people reply to an existing comment 😞. Follow me on my Twitter page: @excel_ladz 🔥
How do you do this method at the beginning of the season with zero data? Use last season's data?
I feel you can use R. as soon half of the season is done, define training and test data. Its better for prediction
What would be the (POSS) that comes in your worksheet?
HI lad, make sure to subscribe if you enjoyed the video! The POSS that comes into my worksheet is the average level of possession that team had scored throughout the 2021 English Premier League season. I then use this stat to predict the outcome of matchups between these teams, assuming there is a correlation between a team's performance and their level of possession.
Poos verisi sitedenbu görünümde değil ama iki sayfa yaparak oradan buldurarak yaptım
😢😢 correct score please help me teach us bro
Have a look at the video I just posted lad 🔥
Regrayyon analisi doğrusal analiz
Binom ters formülümilede sayım üreterek yüzdeliği verdirdim
man this is full complicated!!!!!!!
Aynısını yaptım
Ben yapamadım bana gönderebilir misin?
@@Fahri-55 nasıl göndereyim
@@Fahri-55 aslında yüzdelik olarak %70sin üstündeki veriler oda oranlar zatrn 1.25 gibi oranlar