Thanks David. I'm back for another lesson. What was different about this video is that you made clear what weakness does this approach overcome. I like that you showed it to be a step up from historical standard deviation. I wish there was a video where the focus was only on the weaknesses of methods and how other measures of volatility were introduced to overcome those issues. For example, standard deviation, EMWA, GARCH (1,1), and so on.
You are saying that Day 0 is today and Day 1 is yesterday. But Your return calculation has swapped the numerators and denominators. Otherwise concept is clear
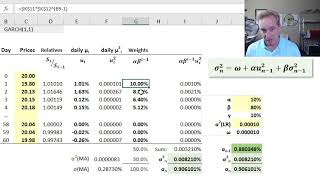
It may be important to show the correct formula of the first weight, instead of (1-lambda) it should be (1-lambda)/(1- lambda^N) cause if lambda is .99 or .98, using (1-lambda) in the first weight wont get a sum that gets close enough to 1 if you have 262 observations or so.
This simulation assumes that day zero is today's closing price and day 1 is yesterday's price such that the most recent log return = LN(20/19.80) = +1.01% and this most recent return is assigned the highest weight of 20.0%. However, I admit the presentation of the time dimension here is sub-optimal, or maybe even confusing: I can see why you'd assume 60 is the most recent day for a couple reasons. I could have shifted the yellow column of prices down one row (to better align the most recent return with the most recent price; maybe helps a little) and I SHOULD have labelled the days with (eg) "t -1, t-2" to convey they are going back in time. Thanks because next time i'll make that more clear!
@@bionicturtle Thank you so much for responding, I understand it better now. However, then if I'm not mistaken there is a typo in the "price relative" column. The first calculation in cell D8 is congruent with your explanation and the price relative formula but in cells D9:D68 you swich the numerator with the denominator making the price relative "inversely". This was the main reason I thought day 60 was the most recent day.
@@mariana__7814 Oh, yes, sorry, you are totally correct! That's just a flat out MISTAKE in the XLS (I must have switched my intention with respect to the direction of time). No wonder you thought D60 was most recent. So this is just an error with the XLS, unfortunately: column D should be consistent. Fortunately, because column C is a random price vector anyway, we can just view column D as the historical series INPUT (of price relatives). Thank you for your observations, sorry for the confusion!


Thanks David. I'm back for another lesson. What was different about this video is that you made clear what weakness does this approach overcome. I like that you showed it to be a step up from historical standard deviation. I wish there was a video where the focus was only on the weaknesses of methods and how other measures of volatility were introduced to overcome those issues. For example, standard deviation, EMWA, GARCH (1,1), and so on.
No... understand the term persistent first. Your will make mistake in exam without thoroughly understanding persistent
can someone give me Bionic Turtle's xls file, i click the link but its has been delete
You sir, saved my day!
Glad to hear it, thank you!
You are saying that Day 0 is today and Day 1 is yesterday. But Your return calculation has swapped the numerators and denominators. Otherwise concept is clear
I don't understand: is the EWMA for the estimation or for historical data only?
It may be important to show the correct formula of the first weight, instead of (1-lambda) it should be (1-lambda)/(1- lambda^N) cause if lambda is .99 or .98, using (1-lambda) in the first weight wont get a sum that gets close enough to 1 if you have 262 observations or so.
Why is the day 1 price relative amount of 0.90909 calculated as Si-1/Si rather than inversely as the other days all are?
How do we calculate the volatility n-1
Thank you for explaining. Just a thought, what do you think of this method to other parametric methods?
Thank you very much! One question, how do I start with regards with my volatility calculation? What is my variance at time t=0?
It's empty. You can see that in Bionic Turtle's xls. There is only the closing price and nothing to compare it to until t=1
can you give me Bionic Turtle's xls file, i click the link but its has been delete
@@DamiensRegicide
what is the so-call "half-life" in EWMA? tia
If day 60 is the most recent day, shouldn't the strongest weight start from bottom? Meaning cell G68 = 20.0 %, G67 = 16.0%, etc. Thank you!
This simulation assumes that day zero is today's closing price and day 1 is yesterday's price such that the most recent log return = LN(20/19.80) = +1.01% and this most recent return is assigned the highest weight of 20.0%. However, I admit the presentation of the time dimension here is sub-optimal, or maybe even confusing: I can see why you'd assume 60 is the most recent day for a couple reasons. I could have shifted the yellow column of prices down one row (to better align the most recent return with the most recent price; maybe helps a little) and I SHOULD have labelled the days with (eg) "t -1, t-2" to convey they are going back in time. Thanks because next time i'll make that more clear!
@@bionicturtle Thank you so much for responding, I understand it better now. However, then if I'm not mistaken there is a typo in the "price relative" column. The first calculation in cell D8 is congruent with your explanation and the price relative formula but in cells D9:D68 you swich the numerator with the denominator making the price relative "inversely". This was the main reason I thought day 60 was the most recent day.
@@mariana__7814 Oh, yes, sorry, you are totally correct! That's just a flat out MISTAKE in the XLS (I must have switched my intention with respect to the direction of time). No wonder you thought D60 was most recent. So this is just an error with the XLS, unfortunately: column D should be consistent. Fortunately, because column C is a random price vector anyway, we can just view column D as the historical series INPUT (of price relatives). Thank you for your observations, sorry for the confusion!
@@bionicturtle no worries, thank you very much for clarifying!
@@bionicturtle just putting dates on the left would do :)
can you explain why the number in 2 first row appeared in the video is not the same as those in the excel file?
Great video
In Excel Data Analysis tool pack we have installed EXponentially smoothing Average Function. can we use that?
I have not used it, sorry, don't know
Thank you
Thanks a lot sir
How does 0.000003 * 20% give 0.0001? That would give you 0.0000006?
Yes correct, but it's just that 0.0000006
rounds to 0.0001%; my Excel is displaying 0.0001% but the underlying value at cell H8 is 0.0000006