I didn't find any youtube videos with this much explanation about RSM. Worthfull 30 minutes in my day. Keep doing more videos like these sir. All the Best.
so basically initially you described what response spectrum is, and at the last from 23:18 whatever you described is the response spectrum analysis, is it so?
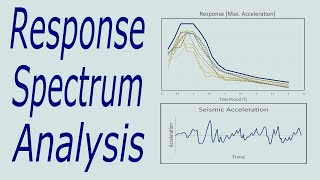
Kindly confirm. At 12:30 minutes, where you show on the left the plot of Displacement-Time-Period of SIX various time period displacement-time graph(6 colors) have nothing to do with various damping ratio highlighted in the right side of slide (6 colors)
Hello peter. The plot shown on the left side has nothing to do with the damping ratio shown on right side. Please note, the plot shown on left was for a random constant damping ratio.
Sir, thank you for explaining it. Please can you start a new design course such as designing of various building components? Or a course on Earthquake engineering?
thanks for such a nice video..but i steel did not understand how we convert time-acceleration (earthquake data) to accelration-period (design spectrum)? Becouse earth data comes with time and time converted to period...in this particular transition what formula we use? have any video to explain pls or planig to make such a video? thanks
Good question @HZL. I think you have to revisit the complete video again. Earthquake data is not directly converted to design spectrum. Design spectrum is arrived by a combination of seismic responses of different structures with different time periods
Thanks for explaining the concept in graphical manner. Need to understand reason to create Response in terms of Displacement, Velocity n Acceleration ? Why IS 1893 uses REsponse Acceleration graph only. You can suggest any link also.
What i've understood is that, design seismic response spectrum is drawn for a specific magnitude of seismic force (ground vibrations) In different area, there is different magnitude of maximum ground vibration that has occurred in history and this is what shall be used in the design. Does the code has design spectrum for each area or its general for all over the country?
Friend, Remember that when you expressed SPECTRAL ACCELERATION ( a ), in terms of displacement ( D ), ,, the equation of ( a ) shall be a = D / T^2 then , when Natural Time Period ( T ) is zero ( 0 ), SPECTRAL ACCELERATION ( a ) is INDETERMINITE, and your RS CURVE will not meet at Zero origin of x and y axis , BUT THE TRUE SPECTRAL CURVE, when T is approaching near Zero, the Line of Curve will go higher and higher at the y axis BUT will not meet zero, coz when you plug zero in formula you will have ERROR result .. . So your RSA is partially wrong
Designing for the max base shear would be highly conservative and uneconomical. That's why we average them out with various type of combinations like SRSS, CQCetc
Nice Presentation Sir, I have one doubt regarding design response spectra which was mentioned in the IS 1893.Why it is indicating some spectral acceleration at zero time period ,then why it is increasing linearly and then why it is constant in the certain time period? only because of Response reduction factor or is there any other reason?
Good morning sir I have to make a dissertation on topic"to study the effect of seismic loads on concrete silos". Please guide me sir and provide some matter related to this topic Thank you
To determine the damping ratio, one must know how much seismic response (displacement or velocity or acceleration etc) is being discipated per each cycle of vibration..


I didn't find any youtube videos with this much explanation about RSM. Worthfull 30 minutes in my day. Keep doing more videos like these sir. All the Best.
Will do definitely 👍
Reddy watching this video and remembering your explanation before exam in Telugu brings smile on face 👌👍😂
best video to understand seismic response spectrum
Explaining minute things in a great way.. Thanks ACE Engineer
Sir, Really a Fantastic presentation. Your knowledge in seismic is excellent sir.
Very good way of explanation.
Fantastic Explanation!!!!!
VERY WELL EXPLAINED!!! THANK YOU!!
Your video is a treasure. I'm just confused what is time history analysis.
It is an analysis performed by varying the time of application of a load for any dynamic response of a structure.
Very very useful video, thank you sir, please make video on Time History Analysis (THA) also
Excellent presentation
Thank u so much sir for this crystal clear explaination
Very Good presentation. Explained concepts in deep. thank you
Very creatively explained... Thanks 😊
Very good explanation. Thank you very much.
Very well explained. I want to know how to generate Response Spectra for different time periods of a particular earthquake ground motion/ signal.
Wonderful explanation!
so basically initially you described what response spectrum is, and at the last from 23:18 whatever you described is the response spectrum analysis, is it so?
Yes
Great presentation. Thank you
Very well illustrated
Thank u
Very good explanation
Kindly confirm. At 12:30 minutes, where you show on the left the plot of Displacement-Time-Period of SIX various time period displacement-time graph(6 colors) have nothing to do with various damping ratio highlighted in the right side of slide (6 colors)
Hello peter. The plot shown on the left side has nothing to do with the damping ratio shown on right side. Please note, the plot shown on left was for a random constant damping ratio.
Nice sir.......sir make a detailed video on cqc and srss method....
Sir pl upload an illustrative example of response spectrum analysis of a building structure. Thanks sir for the excellent video
Sir really very much useful info 😃 plz can u solve an example on rsm
Sir, thank you for explaining it. Please can you start a new design course such as designing of various building components? Or a course on Earthquake engineering?
Sure shareq... It's already there in my 'to do' list
please also post video for CQC method in detail
So response spectrum curve represents pick responses of different masses for a specific ground motion?
@@acecivilengineer6863 m1, m2 ,m3 , m4 different masses.
thanks for such a nice video..but i steel did not understand how we convert time-acceleration (earthquake data) to accelration-period (design spectrum)? Becouse earth data comes with time and time converted to period...in this particular transition what formula we use? have any video to explain pls or planig to make such a video? thanks
Good question @HZL. I think you have to revisit the complete video again. Earthquake data is not directly converted to design spectrum. Design spectrum is arrived by a combination of seismic responses of different structures with different time periods
@@acecivilengineer6863 thanks for answer..ı will get time to watch all your videos..for finding answer..
Sir,
What exactly is a normalized RSA graph and in the is 1893 RS graph why do we have an acceleration for zero time period?
Good video
Thanks for explaining the concept in graphical manner.
Need to understand reason to create Response in terms of Displacement, Velocity n Acceleration ?
Why IS 1893 uses REsponse Acceleration graph only.
You can suggest any link also.
Can you explain this same using StaadPro or any other structural engineering software
Sure
How this presentation is .....posted in environmental engineering and environmental management .....post graduate programme....??
What i've understood is that, design seismic response spectrum is drawn for a specific magnitude of seismic force (ground vibrations)
In different area, there is different magnitude of maximum ground vibration that has occurred in history and this is what shall be used in the design. Does the code has design spectrum for each area or its general for all over the country?
I would say, design spectrum is similar but not same for different country codes
@@acecivilengineer6863 Understood. Thank for your response Sir.
Friend,
Remember that when you expressed SPECTRAL ACCELERATION ( a ), in terms of displacement ( D ), ,,
the equation of ( a ) shall be
a = D / T^2
then , when Natural Time Period ( T ) is zero ( 0 ),
SPECTRAL ACCELERATION ( a ) is INDETERMINITE,
and your RS CURVE will not meet at
Zero origin of x and y axis ,
BUT THE TRUE SPECTRAL CURVE, when T is approaching near Zero,
the Line of Curve will go higher and higher at the y axis
BUT will not meet zero, coz when you plug zero in formula you will have ERROR result .. .
So your RSA is partially wrong
Why are we combining all the base shears? Why dont we design for only the maximum base shear
Designing for the max base shear would be highly conservative and uneconomical. That's why we average them out with various type of combinations like SRSS, CQCetc
Nice Presentation Sir, I have one doubt regarding design response spectra which was mentioned in the IS 1893.Why it is indicating some spectral acceleration at zero time period ,then why it is increasing linearly and then why it is constant in the certain time period? only because of Response reduction factor or is there any other reason?
It is basically a normalised graph in IS 1893. Practically the the graph would be a rising and falling pattern..
Good morning sir
I have to make a dissertation on topic"to study the effect of seismic loads on concrete silos". Please guide me sir and provide some matter related to this topic
Thank you
I have less experience in silos abdullah...i wish i had some knowledge in it to help u out
@@acecivilengineer6863 sir can you tell me which software will be good to do response spectrum analysis
Staad and etabs are equally good in it...
How to determine the damping ratio?
To determine the damping ratio, one must know how much seismic response (displacement or velocity or acceleration etc) is being discipated per each cycle of vibration..
@@acecivilengineer6863 thank you.
Thank you sir
Nice
❤❤❤
The simultaneous translation into Spanish is wrong
Thanks sir
The simultaneous translation into English is wrong