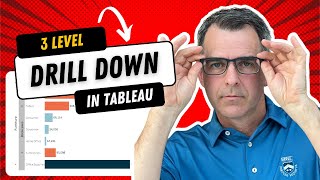
0:39 - #1 Classic bar Chart 0:54 - #2 Outline Bar Chart 1:16 - #3 Stacked Bar Chart 1:35 - #4 Percent Total Stacked Bar Chart 1:49 - #5 Rounded Bar Chart 2:29 - #6 Divergent Bar Chart 3:21 - #7 The Lollipop 4:09 - #8 Butterfly Chart 5:57 - #9 Bar Chart with a linea on the end 6:29 - #10 Bullet graph 7:26 - #11 Progress Bar 8:08 - #12 Progress Bar with extra content 9:18 - #13 Progress thin bar 10:27 - #14 Bar inside of a bar chart 11:08 - #15 Side by side bars 11:41 - #16 Bar chart and candlestick chart combination 13:43 - #17 Progress area bar chart 14:06 - #18 Jittered bar chart
@@vizwiz Yes, this one is superior. Question... if I've got four different metrics, each with their own goal (not relative to the same "1")- how can we format to visually render similarly if we need to build them separately?
With this kind of tutorial you could do a speed run. JK. Actually it's a rare gem, great tutorial, amazing video, top notch step by step, and beautifuly execution. Just awesome
Thank you for a fantastic tutorial, Andy! I am looking to add a reference line in the butterfly chart to highlight the variance between the two sides. Is this possible? I would really appreciate your expertise to see if this is worth exploring further.
Hi Andy; thanks for all the tips! The negative mark labels in the butterfly chart bother me a little; I find it neater to edit the axis and set scale to "Reversed" ;)
Great video. Can you create one for tables? Explain how to get rid of the "abc", set column sizes, make column titles, how to make an all text table, ....


This video is a masterpiece of inestimable value!!! Thanks Andy from down under!
Amazing, thanks!
0:39 - #1 Classic bar Chart
0:54 - #2 Outline Bar Chart
1:16 - #3 Stacked Bar Chart
1:35 - #4 Percent Total Stacked Bar Chart
1:49 - #5 Rounded Bar Chart
2:29 - #6 Divergent Bar Chart
3:21 - #7 The Lollipop
4:09 - #8 Butterfly Chart
5:57 - #9 Bar Chart with a linea on the end
6:29 - #10 Bullet graph
7:26 - #11 Progress Bar
8:08 - #12 Progress Bar with extra content
9:18 - #13 Progress thin bar
10:27 - #14 Bar inside of a bar chart
11:08 - #15 Side by side bars
11:41 - #16 Bar chart and candlestick chart combination
13:43 - #17 Progress area bar chart
14:06 - #18 Jittered bar chart
Ah fantastic! Thank you. I'll add that to the description.
How to create stacked donut chart with 2 measures
This is my GOAT for doing this.
You are ocean full of knowledge Thanks you so much
Very helpful video Andy. Some were difficult, but I'll try my best to recreate this. very inspiring tutorial. Thanks a ton :)
Thanks Andy, I do love some good bar charts. Simple and effective 😄
Glad you like them!
That's Amazing. Thanks Andy!
Thanks Andy, Great video as always. Very informative 💯
I love your video, really superb work! keep it up Andy
I love that progress chart with the quartile lines. Thanks for the great tips
You are so welcome!
@@vizwiz Yes, this one is superior. Question... if I've got four different metrics, each with their own goal (not relative to the same "1")- how can we format to visually render similarly if we need to build them separately?
Really like the disaggregated jitter plot! I’ll def be using that
Its always good to review the basics. Hard to beat a good barchart.
Indeed!
Thank you so much Andy
This is really good. Thank you for sharing with the community :)
Great viz. I like that is clean and have a modern look to it!
Thanks!
Thank you Andy💯🥰
Thanks Andy!
Super! Thanks so much
Thank you very useful
I like it)
Thank you! 😊
You are THE BEST
With this kind of tutorial you could do a speed run. JK. Actually it's a rare gem, great tutorial, amazing video, top notch step by step, and beautifuly execution. Just awesome
Glad you liked it!
Thank you so much
You're most welcome
Andy 🎉 sir highly informative video thank you so much sir for making such video ❤
Thank you for a fantastic tutorial, Andy! I am looking to add a reference line in the butterfly chart to highlight the variance between the two sides. Is this possible? I would really appreciate your expertise to see if this is worth exploring further.
Definitely possible
Hi Andy; thanks for all the tips! The negative mark labels in the butterfly chart bother me a little; I find it neater to edit the axis and set scale to "Reversed" ;)
I should have formatted the axis to only show positives.
Hi Andy! This is extremely helpful. I have a doubt, in the butterfly chart ; for 2021, how do we get rid of the negative sign near to the labels ?
This guy is truly amazing, if he just slow down a bid.
Thanks for the feedback. Pause along the way if it's too fast. 👍🏻
Thank you for the Video. how can I get dataset for this work?
Great video. Can you create one for tables? Explain how to get rid of the "abc", set column sizes, make column titles, how to make an all text table, ....
I doubt I will ever create a video on tables since I'm trying to move people away from them.
As always i really like your videos. That are very useful for me. Did you have to catch a train?
I don’t understand.
@@vizwiz referring to the tempo , like in a hurry to finish the video
You are very fast. that is 👍 @@vizwiz
Hi Andy, why is there no tooltip for the RANDOM() function in the calculation window?
what is the difference n/w divergance and butterfly chart? Please explain.
Sir, for the butterfly chart, how can you remove the negative sign that apears on the values ?
Thanks
Don’t I cover that in the video?
Great content! Can you show us how to do a curved Bar Chart, please?
What do you mean by curved?
Blimey!!!!!!
hi great content, wish to have types of pie charts aswell.
There’s only one type of pie chart.
@@vizwiz I mean the radial charts, sun burst etc that can be used to show percent of total
How to create my one colour pallet like he created VizWiz blue?
Here you go th-cam.com/video/NcRybnitBU8/w-d-xo.html
i think Option C
Tks, but Tableau sucks!!! :(