
ฝัง
- เผยแพร่เมื่อ 16 ต.ค. 2024
- Step by step guide is given here for the code meaning. If you want to creat meta data and facing trouble comment here. I'll make a video on that. Also I have added a smaller interpretation. If you want an elaborated one. Comment and I'll help.
Import data in R: • How to import data in ...


I kept getting an error message ‘event.c’ is Null and idk what that means… i give up…
Thank you so much for this video! I've been searching how to change the metanalysis from RR to OR and I finnaly learned it with you! I am really thankful right now! Greetings from Brazil!
I have data on odds ratios from various studies, how do I pool them for meta-analysis?
this worked great.
when i am using a huge set of studies the forest plot is going out of focus and i cant zoom in or out or check the analysis, i can just see a portion of the forest plot that fills my screen
any way to tackle this issue? i am having 59 studies in my selection right now.
Thank you for this video. Is it possible to move under the whole line of heterogeneity because it is very close to the x-axis? Do you know how to do that? Many thanks
No. I don't know how to do that.
Thank you for the video.. how do I create meta data unique for data set?
I really appreciate you taking the time to record this. Very informative and to the point.
Thank you for your nice compliment and for watching.
Hello, thank you for the helpful video. I am new in meta-analysis, I kept trying but just realized metabin is only for risky ratio, odds ratio, risk difference, and arcsine difference.
Could you please share how to do a forest plot after already have effect size (Standardized Mean Difference) and sample sizes in R ? and how to do inverse variance weights and 95% CI in R? Not sure if this is important, but fyi, I calculated SMD by t-value, or F ratio in the study by excel, I didn't use SD, df, mean from raw data to get SMD.
Thanks once again for the video. :)
bookdown.org/MathiasHarrer/Doing_Meta_Analysis_in_R/
Please check this website. Hope you'll find what you are looking for
bookdown.org/MathiasHarrer/Doing_Meta_Analysis_in_R/
Check this please
@@EasyStat thank you.
Thank you so much. Please make a video on metadeta
Thank you so much for your smart video. Really I admire your work. I have faced a problem in abstracting data from articles and analyzing the results for meta-analysis study on prevalence of tuberculosis and also creating a forest plot for that. Please ,can you help me in this regard? which statistical package is easy to use? Thanks.
can you make a video on how to calculate and make forest plots for weighted mean difference in R?
thank you
I'm currently busy with my article on COVID-19. Please check this link. You may find your required information,
bookdown.org/MathiasHarrer/Doing_Meta_Analysis_in_R/generating-a-forest-plot.html
What if I want the bottom row to consist only of the "random effects model" ? meaing I only want the random effects model of this forest plot.
Thank you for your helpful video.
Hello Meera, first of all sorry for late response. You have to use a additional command inside command forest(fit) as:
comb.fixed=F
This will remove fixed effect from plot. The whole command is as follows:
forest(fit,comb.fixed=F)
Thanks for watching my video.
Easy Stat I have also been wondering how could I perform a leave-one-out sensitivity analysis in meta data (using the example in your video maybe?). Very grateful for your help.
hi ,
can anyone help to edit the header text. i want to change the experimental and control headers to the headings in my data
Thanks for this tutorial :) Do you know if it is possible to store the forest plot with a name? E.g. plot
Excellent video.
Thank you so much for your tutorial!!! Could you help me about this warning?
p.s I already installed package called meta
> y=metabin(n1,y1,n2,y2, studlab = study,data= data2,sm="RR")
Warning messages:
1: In metabin(n1, y1, n2, y2, studlab = study, data = data2, sm = "RR") :
Studies with event.e > n.e get no weight in meta-analysis.
Could someone please explain how this Chi-square (766.20) appearing in the above video at 11.03 minutes. I could calculate using Expected values when we have independent variables, but here we have experimental and control with event and N for each. is there any formula or logic to calculate this 766.20. Thanks in advance
Introduction to Meta‐Analysis
Author(s):
Michael Borenstein
Larry V. Hedges
Julian P. T. Higgins
Hannah R. Rothstein
Please read this book you'll get your required answer.
Hi
Thank you so much for this video. This is really very very helpful. My query is that I want to make a forest plot and for this, I have already calculated the odds ratio and confidence interval. I just want to make a forest plot to show my numeric values in a good visual form. Could you please guide me.
When I am using the command as shown in your video, the output is showing an error. Please help!! :(
y=metabin(Odds,Lower,Upper,studlab=Factors,data=d,sm="OR")
Error: Argument 'n.c' is NULL.
Hello dear,
Please check here. Hope you'll find what you're looking for
bookdown.org/MathiasHarrer/Doing_Meta_Analysis_in_R/
Thank you very useful
Thanks for the tutorial. How we can entering total data without event parts?
thank you for your video!
I am Doing my meta-analysis but can't work, the error comes at the y=metabin command like some time event.e is more than c.n or others. What is the reason and how i can solve it?
I think you're doing wrong with your meta data. Please send me your meta data I'll help you find the error. Thanks
akashrahman32@gmail.com
hey. have u built forest plot in metafor package as well?
i am doing meta analysis in metafor package and currently facing some issues would you be able to help? thanks
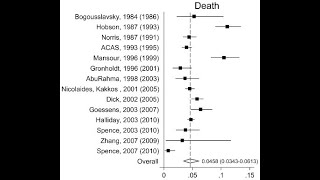
This is a really informative video thank you very much. However, I'm confused as to why the points for Jordan and Peru are different to the rest. Do you know why this is the case? Thanks in advance
Sample size in Jordan and Peru are noticably small. Which is the reason of wide confidence interval those two countries.
@@EasyStat thank you
I could not find the meta package in my package section. Anyone care to help me how could I get it ?
How to do forest plot using mean score results and standars deviation results..ty
I need the same info
Hi. could you help creating forest plot please? Thank you
Excellent, Thank you very much for this video. could you please clarify as How to add Chi-square value also
I'm really sorry. If you can guide how to calculate the chi-square value for the meta-analysis then I can try. Thanks for watching
@@EasyStat Sorry, you are already demonstrating that as print.Q=T. we getting chi-square value with that as 766.20.
thank you . it was so helpful.
Thank you
Error in metabin(severe.d, Severe.total, nonse.d, Nonse.total, studylab = Country, :
object 'Country' not found
can you please help sir
Do your data consists country?
@@EasyStat I actually wrote studylab instead of studlab. I managed to make it work a day after I posted that comment when I realized the error in my code. Nonetheless your video has been of great help.
I should have replied to you at the earliest possible time. But I was busy with my current meta Analysis on COVID-19 that's why I couldn't reply in time.
Its good to hear that you have found a solution to your problem.
Thanks for watching
How can we make meta data
To make a meta data you need to run a cross-table SPSS, then arrange then in such a way that represents the control group and treatment group frequency with respect to success and failure of the dependent variable. I can make a video on it. If you need inform through comment.
To make a meta data you need to run a cross-table SPSS, then arrange then in such a way that represents the control group and treatment group frequency with respect to success and failure of the dependent variable. I can make a video on it. If you need inform through comment.
Yes sir please make a video. Thanks alot
dear sir,
y=metabin(event.e, event.c, n.e, n.c,studlab=Author,sm="OR",data=data)
Error in metabin(event.e, event.c, n.e, n.c, studlab = Author, sm = "OR", :
could not find function "metabin"
This is the error im getting after install the meta package
Pls help me out asap.
y=metabin(event.e, event.c, n.e, n.c,studlab=Author,sm="OR",data=data)
Warning message:
In metabin(event.e, event.c, n.e, n.c, studlab = Author, sm = "OR", :
Studies with event.c > n.c get no weight in meta-analysis.
now im getting some what like this
how to resolve this
Thanks in advance
Hello Mahes,
Did you load the package meta?
library(meta)
If this doesn't solve the issue please send me the screenshot of your problem at: easystatenglish@gmail.com