In the excel ssheet you used please advise what type of chart *(as what excel application calls it) was used to create the graphic tracking the 2 series of actual vs estimated progress, thanks
Hello, thank you for your excellent tutorial, but i have a question, how to generate a progress curve in EXCEL like your video that the x axis is year and month, but the y axis is the progress of every month
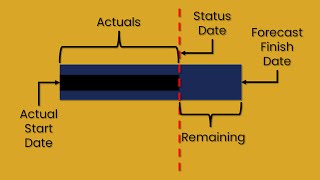
Thanks for your training, it is very useful. But could you advise how to add forecast in S curve. Compare baseline VS actual +forecast, it will be more better to see the overall status against baseline
its very simple, save it as separate file (or baseline), open it and make it 100% complete, then follow as per the video to extract values. To your notice we also have a hot course on Microsoft Project on discount the link is >>>www.udemy.com/course/microsoft-project-2019-course-for-beginners-to-adavnced/?referralCode=F3D0137408624B581FC4
Dear Adam Peter yes, am going prepare the course on it will be released in a months time :) personally if you have a further query kindly write to us at info@primeprojectcontrol.com
Once cost loading is done, you can get cumulative cost curve, Please free to contact me at info@primeprojectcontrol.com if you have trouble to carry out..
Hi, Thanks for the video. How do this s-curve with the data dates instead of %? because some actual tasks will start late or even ahead of the planned/baseline dates.
hi Maxwell, i believe you want to know how to add actual progress S curve ? if that is your requirement - you can create a row below and insert actual %, also can create an early and late curves.
@@hanawafis755 Dear Hana, To show early and late curves, firstly once you saved as a baseline changes; change the column for early dates (start & finish) copy the data and paste in excel to generate early curve and the same way do it for late. Thanks :) @hana wafis
Dear Ahmad, U no need to create any formula in Excel. Step (1) Create a table showing month/Week rows, similar to the setting as shown in Microsoft Project, than copy the Planned Values from MSP and Paste it in the table of excel, and click to generate graph. I hope answered your query please feel free to write me at info@primeprojectcontrol.com
Pls put video for cost loading and cash flow generation. Where BOQ is available with Qty and Rates are also available. The Rates are on per Cum, per Sqm basis ( Post Civil works on item Rate contracts )...
Sir, will you able to connect 20 minutes online session for me? I have try so many times but it won't come excel where did I mistake I don't know I would like requested to you.


Learned a lot
😇
thats easy method....perfect solution for me. Thank you
Welcome Kiran, Please subscribe
This is very useful yet fastest way to obtain the S curve...Thanks for the tutorial video
Thank you, please subscribe
Will you able to two session class I will pay the money
I will quickly, send me google invitation link at info@primeprojectcontrol.com
In the excel ssheet you used please advise what type of chart *(as what excel application calls it) was used to create the graphic tracking the 2 series of actual vs estimated progress, thanks
Hello, thank you for your excellent tutorial, but i have a question, how to generate a progress curve in EXCEL like your video that the x axis is year and month, but the y axis is the progress of every month
Thanks for your training, it is very useful. But could you advise how to add forecast in S curve. Compare baseline VS actual +forecast, it will be more better to see the overall status against baseline
Hi. What is the problem if my cumulative % complete in scurve doesnt get 100% at end project? It only reach 90%
How to automatically display cumulative % complete with decimal points?like 50.45% instead of 50%?
which version MSP you are using
Sir, I have seen your video, but last three minutes I m unable to understand. Could u able to teach to me.
Dear Venkatesan
Please update 100 % in Microsoft Project
Save as or Export or Copy the data into Excel
Use S chart function and generate the curve
Hi I have obtained actual work S curve. But how to obtain Planned S curve?
its very simple, save it as separate file (or baseline), open it and make it 100% complete, then follow as per the video to extract values. To your notice we also have a hot course on Microsoft Project on discount the link is >>>www.udemy.com/course/microsoft-project-2019-course-for-beginners-to-adavnced/?referralCode=F3D0137408624B581FC4
@@PrimeProjectControl Thanks
Can u show how to implement project extension of time due to covid in the program and s curve?
Dear Adam Peter yes, am going prepare the course on it will be released in a months time :) personally if you have a further query kindly write to us at info@primeprojectcontrol.com
How about cummulative cost? How do i change?
Once cost loading is done, you can get cumulative cost curve, Please free to contact me at info@primeprojectcontrol.com if you have trouble to carry out..
i can advise based on which version of Microsoft Project you are using!
Hi, Thanks for the video. How do this s-curve with the data dates instead of %? because some actual tasks will start late or even ahead of the planned/baseline dates.
hi Maxwell, i believe you want to know how to add actual progress S curve ? if that is your requirement - you can create a row below and insert actual %, also can create an early and late curves.
@@PrimeProjectControl how do you want to show early and late curves?
@@hanawafis755 Dear Hana, To show early and late curves, firstly once you saved as a baseline changes; change the column for early dates (start & finish) copy the data and paste in excel to generate early curve and the same way do it for late. Thanks :) @hana wafis
May i know the excel formula that you created for s curve? Thank you in advance
Dear Ahmad, U no need to create any formula in Excel. Step (1) Create a table showing month/Week rows, similar to the setting as shown in Microsoft Project, than copy the Planned Values from MSP and Paste it in the table of excel, and click to generate graph. I hope answered your query please feel free to write me at info@primeprojectcontrol.com
Pls put video for cost loading and cash flow generation. Where BOQ is available with Qty and Rates are also available. The Rates are on per Cum, per Sqm basis ( Post Civil works on item Rate contracts )...
Dear Ravindran Sir, Noted the Cash Flow Generation will be made available soon!
@@PrimeProjectControl Thank you.
Thank you for making this video available. I find the background music very annoying and unnecessary. Less is more. :)
great but quite low definition man
In excel it was not come
Did you follow the steps I have explained and you can copy into excel!
Sir, will you able to connect 20 minutes online session for me? I have try so many times but it won't come excel where did I mistake I don't know I would like requested to you.
@@venkatesans8698 Please send google invitation link to the email
Too loud background music..can also reduced next time😊😊
Background music is very loud and distracting! 🙄