How To Create KPI Visuals In Power BI | KPI In Power BI | Power BI Tutorials | Simplilearn

ฝัง
- เผยแพร่เมื่อ 17 ก.ย. 2024
- 🔥Microsoft PowerBI Certification (PL-300) - www.simplilear...
🔥Post Graduate Program In Data Analytics: www.simplilear...
🔥IIT Kanpur Professional Certificate Course In Data Analytics (India Only): www.simplilear...
🔥Caltech Data Analytics Bootcamp(US Only): www.simplilear...
🔥Data Analyst Masters Program (Discount Code - YTBE15): www.simplilear...
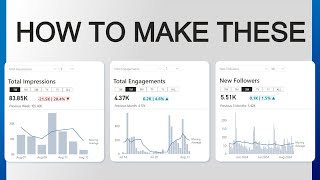
Unlock the full potential of your data visualization capabilities with Power BI Charts featuring timestamps! In this tutorial, we dive deep into the intricate world of timestamp-based data analysis, guiding you step-by-step through the process of creating dynamic and insightful charts using Microsoft Power BI.
✅ Subscribe to our Channel to learn more about the top Technologies: bit.ly/2VT4WtH
⏩ Check out the Power BI tutorial videos: • Power BI Tutorial Vide...
✅ About Professional Certificate Program In Data Analytics
This Data Analytics Program is ideal for all working professionals and prior programming knowledge is not required. It covers topics like data analysis, data visualization, regression techniques, and supervised learning in-depth via our applied learning model with live sessions by leading practitioners and industry projects.
✅ Key Features
- Professional Program certificate and Alumni Association membership
- Exclusive hackathons and Ask me Anything sessions by IBM
- 8X higher live interaction in live online classes by industry experts
- Capstone from 3 domains and 14+ Data Analytics Projects with Industry datasets from Google PlayStore, Lyft, World Bank etc.
- Master Classes delivered by Purdue faculty and IBM experts
- Simplilearn's JobAssist helps you get noticed by top hiring companies
- Resume preparation and LinkedIn profile building
✅Skills Required
- Data Analytics
- Statistical Analysis using Excel
- Data Analysis Python and R
- Data Visualization Tableau and Power BI
- Linear and logistic regression modules
- Clustering using kmeansSupervised Learning
✅Tools Covered
- Excel
- Numpy
- Pandas
- Powerbi
- Python
- R
👉Enroll now: www.simplilear...
🔥🔥 Interested in Attending Live Classes? Call Us: IN - 1800-212-7688 / US - +1-844-532-7688
👉 Listen to what millions of users say about our courses! www.simplilear...


🔥Post Graduate Program In Data Analytics: www.simplilearn.com/pgp-data-analytics-certification-training-course?Mar24HowToCreateKPIVisualsInPowerBI&Comment&
🔥IIT Kanpur Professional Certificate Course In Data Analytics (India Only): www.simplilearn.com/iitk-professional-certificate-course-data-analytics?Mar24HowToCreateKPIVisualsInPowerBI&Comment&
🔥Caltech Data Analytics Bootcamp(US Only): www.simplilearn.com/data-analytics-bootcamp?Mar24HowToCreateKPIVisualsInPowerBI&Comment&
🔥Data Analyst Masters Program (Discount Code - YTBE15): www.simplilearn.com/data-analyst-masters-certification-training-course?Mar24HowToCreateKPIVisualsInPowerBI&Comment&
Got a Question on this topic? Let us know in the comment section below 👇 and we'll have our experts answer it for you. Thanks!