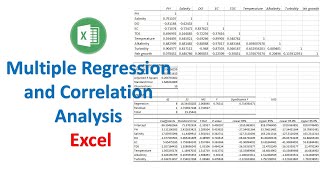
Correlation Analysis in Excel

ฝัง
- เผยแพร่เมื่อ 25 มี.ค. 2023
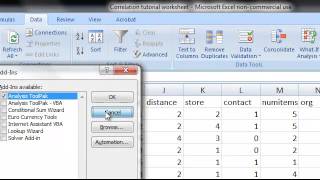
- In this tutorial, you will learn how to Calculate a Correlation Analysis in Excel.
Software Version : Excel 2013
Disclaimer
This Video is made for the sole Purpose of Higher Education. Care is Taken to Provide the most accurate information. However, we can’t guarantee the accuracy of all the information in this video. Kindly do your own research before coming to any conclusions or making any decisions.
#exceltips
#exceltutorials
#excelformulas
#excelfunctions
#excelcharts
#exceldataanalysis
#excelmacros
#excelshortcuts
#exceltemplates
#exceldashboard
#exceltricks
#excelexpert
#microsoftexcel #biostatistics #statistics #dataanalysis #statisticalanalysis
#datavisualization #datascience #dataanalytics #datamining
Playlists:
OriginPro Software: • OriginPro
Past Statistical Software: • Past Statistics Software
GrapPad Prism Software: • GraphPad Prism
SPSS Software: • SPSS Software
Excel Software: • Excel
BioDiversity Pro Software: • BioDiversity Pro 2.0
Minitab Software: • Minitab
Follow me:
Join this TH-cam Channel Membership:
/ @statisticsbio7
Telegram: t.me/statistics_bio7
Instagram: / statisticsbio7
Facebook Page: / statisticsbio7


What about the level of significance???? you have to show the p values
Correlation significant value mean postive correlated and negative correlated.
0 is neutral correlation
+1 is positive correlation
-1 is negative correlation
@@StatisticsBio7 I mean, you have to show whether the numerical values are significant or not(p
* indications significant value that opection only available SPSS any other software I'm not watching it.
the 0.8 above values is highly significant