How To Create A Correlation Matrix In Excel (With Colors!)

ฝัง
- เผยแพร่เมื่อ 8 ก.ค. 2024
- In this video, I’m going to show you how to create a correlation matrix in Microsoft Excel. I will show you how to calculate the Pearson correlation coefficient values for each association, and I’ll even show you how to color code each cell to represent the strength of each correlation.
ONLINE GUIDE
toptipbio.com/correlation-mat...
VIDEO CHAPTERS
00:00 Intro
00:25 My example data
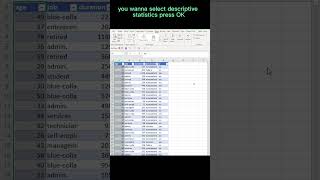
00:50 Installing Analysis ToolPak
01:26 Creating the correlation matrix
02:55 Interpreting the results
05:19 Color code the cells
07:05 Summary
HOW I CREATED THIS TUTORIAL (AFFILIATE LINKS)
Screen recorder & editor techsmith.z6rjha.net/c/198849...
TH-cam SEO www.tubebuddy.com/SHTeach
Software (Microsoft Excel 365 ProPlus)
FOLLOW US
Website toptipbio.com/
Facebook / toptipbio
Twitter / toptipbio
AFFILIATE DISCLAIMER
Some of the above links are affiliate links, meaning I will earn a commission if a sale is made after clicking on the link. - แนวปฏิบัติและการใช้ชีวิต


![[TH] VCT Pacific Stage 2 - Week 4 Day 3 // GEN vs TS | PRX vs ZETA](http://i.ytimg.com/vi/nspkjQuZve0/mqdefault.jpg)


![[페이스캠4K] 베이비몬스터 치키타 'FOREVER' (BABYMONSTER CHIQUITA FaceCam) @SBS Inkigayo 240707](http://i.ytimg.com/vi/x9VRNTV4VDI/mqdefault.jpg)

ONLINE GUIDE
toptipbio.com/correlation-matrix-excel/
Hello sir.Is 0.5 and 0.2 a posive linear correlatiom? Thank yoy
@@malloryalvacastaneda2547 yep. Positive values indicate a positive relationship. With values closest to 1 being a stronger relationship compared with those closer to 0
@@StevenBradburn Thank you. I am having a hard time on data analytics. I have watched and repeated some of your videos.it helped a lot. thank you
Oooo my God. bro you just answered my 6 months struggle in less than 8 minutes. come here let me give you a kiss
This helped me understand how to complete an assessment worth 45% of my overall grade, thank you so so much. You are the only reason I was able to progress.
Dude, I wish more tutorial videos were like this: Quick, good explanations with examples, no stupid fluff where people think they are comedians. Just GREAT content!
Thanks Neil. Appreciate that
I have watched so many video, read so many chapters and nothing made sense. This is by far the most helpful tutorial. Thank you so much.
You are doing an excellent jobs helping the students and researchers . Thank you so much
very clear and practical enough! Thank you!
Exactly what I was looking for... half way through building my own matrix by hand one CORREL formula at a time!
Thanks!
🤣
No tutorial could be better. Thank you
Great tutorial! Thank you so much, made it all seem super easy!
THE BEST TUTORIAL EVER!!!!!❤❤❤
Thanks for the tutorial! Helped me a bunch for my stats class!
Very clear explanation. Thank you so much
Beautiful explanation, thanks for your help!
This is indeed a good tutorial. I learned lot. Thank you sir.
The best I have seen so far thank you
you solved one of my big problems in just a few mins, thanks.
Thank you so much for this. I am currently doing my thesis using EGOVSAT model to measure multiple predictors.
Your tutorial is awesome
Amazing tutorial. Thank you very much
Very Helpful. Thanks
Awesome work man
This is brilliant excellent detail in short video
Perfect tutorial
really thank you brother for this content .i expect more from you like this tutorial
Really helpful!
Amazing! great job!
Thank you so much for your tutorial. Really saved my day!
Thank you. Very useful!
Thank you so much for this video.. too helpful 💯
This was very helpful thanks!!
needed this to analyse the data of my survey for dissertation.
thank you for the guide, it's my first time doing this through excel
Enlightening video thanks
Thank you !!! this helped me a lot.
Great tutorial 🎉🎉🎉🎉
so useful thank you
Very good. Thanks!
It was very useful for me. thanks a lot
Super cool! I bet this replaces the matrix plot with more than one variable in minitab!
Duuude, thank you SO much!
A lot of thanks Sir
thanks mate, helped me with a project
Thank you very much my kind sir, that was extremely helpful.
well explained
Vielen Dank aus Deutschland!!
Nice expleaination many thanks
Perfect.
Thank you for this movie. it help me a lot
Thank you so so so much❤❤😘👌👌❤️
Thanks a lot
OMG i just about did this manually lol wow. You are a life saver my man
Great 👍👍👍
you are awesome dude
Thank you
Explains better than my master degree lecturer :)
best thanks
Great video, great explanation
Thank you Sir
You are welcome
Thanks for the useful video. How can populate the upper part of the matrix?
Great video, thank you!
Is there a way I could click on a cell and get a scatter plot shown for the 2 variables?
thank you for this. After color-coding the cells, is it possible to sort them into clusters according to color? Similar to a clustered matrix.
Braaaaavoooooo for any thing her say
Arigiti gozaimasu
May I please inquire as to whether you can provide the step-by-step directions and instructions as to how to create this same live Correlation Index in Excel...and more specifically with the use of Microsoft Excel RTD/Real-Time Edition...and whereas I am seeking to establish a realtime stock market DDE/dynamic link and whereby an array of stock market exchange tick-by-tick trades are constantly and instantly updated autonomically/automatically @ ultra high-frequency within this Correlation Index Matrix..Thank you
Are the variables in the upper part are the questions?
i d ve put the blue for "cold"/negative and red for "hot"/posistive
wow
I love this. God bless you.
But I have a question. How can we do a dataset with many countries. Eg sub Saharan countries.
Hello Steven. Great information given here. After going through and attempting to use this, I received an error message that says Correlation - Input Range contains non-numeric data. Having a hard time trying to figure this out. Went through the data set to make sure everything was correct and it is. Any suggestions or assistance would be greatly appreciated.
could please make video on "how to create excel data sheet for Pearson correlation coefficient from worldclim data". please please
👍🏻👍🏻👍🏻👍🏻👍🏻
how to add the scale in this correlation matrix??
Can I know the p-values of the correlation matrix?
how to test the signifince of correlation coefficient?can you pls explain
Suggest you watch this: th-cam.com/video/Ev86DMtLXOk/w-d-xo.html
Help!!!
I am getting getting #DIV/0! Instead of the numbers in the correlation table, I followed the same steps.
How to transfer a correlation matrix to a ppt
Thanks a lot