Japanese Candlestick Basics

ฝัง
- เผยแพร่เมื่อ 25 ม.ค. 2018
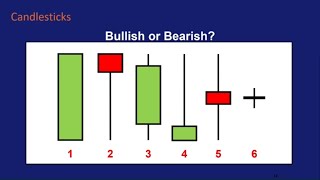
- Charts are the building blocks of trading. Among them the Japanese candlestick is probably the most popular. This video explains what it is in detail and shows just why so many traders and investors prefer them.
Trading expert David Jones goes over the components of the candlesticks. Their body, formed by the open and closing price for the respective period. And their shadows (also known as wicks), showing the highest and lowest price reached within that time frame.
Visit us at trading212.com
Download our free mobile apps for iOS or Android:
trading212.com/GetTheApp
------------------------------------------------------------------------
📲 Trading 212 on Social Media:
/ trading212
/ trading212
/ trading212
/ trading212
community.trading212.com
------------------------------------------------------------------------
#Investing #Trading #Equities #trading212
The information contained within the video was correct at the time of recording but may have since changed.
At Trading 212 we provide an execution only service. This video should not be construed as investment advice. Investments can fall and rise. Capital at risk. CFDs are complex instruments and come with a high risk of losing money rapidly due to leverage. 81% of retail investor accounts lose money when trading CFDs with this provider. You should consider whether you understand how CFDs work and whether you can afford to take the high risk of losing your money.


Clear, concise, brief. A pleasure to watch . Thank you
Like it very much!!! Excellent presentation style: clear summary of what to expect at the beginning followed by real charts. BEAUTIFUL PRESENTATION!!! WELL DONE DAVID.
Oh! and congratulations on an excellent standard of Training Video's
Great video. Concise and clear explanations. I'm finding all your trading explanation videos very useful! Thanks!
Very helpful information well presented!
You are a great teacher, thank you!
I really liked this video. Very well explained and I liked that it didn't have background music which usually adds to distraction for me. SUPER WELL DONE!
Thanks again always a easy explanation and a good video's all the time
:-)
What a great teacher
Thanks for training vids great content
I love trading 212's new interface. Its very intuitive.
I've literally just started trading (starting in FX) and I instantly fell in love with candlestick charts, plan to use them pretty much all the time as they're easy to read and are so clear to analyse what's happening in the markets.
Love this video as it gave me a better understanding pretty much to me having a complete understanding of reading them so that's gonna help massively.
Thank you very much!
Thank you, helpful..
Can i ask a question? Do u have any idea on which app for android that has renko chart?
Can you please share your opinion on Kagi and/or Renko charts? I've heard they are good for spotting trends that may be harder to see on candlestick charts, but I'm not sure if I'd benefit from adding them to my decision process. Thank you!
Great Video
Thank u david sir...love yur videaos
very helpful.
Does a candlestick with no body give us a signal? Could you explain more if there is any signal it could give or what to do when we see a line of these kind of candles??
Could you please make videos about other kinds of Candlestick's (and provide comparisons how well they signal in different scenarios?) , e.g. Heikin-Ashi Candlesticks or separate on Ichiomoku Cloud. Thank you for providing great content!
Great video, I still have a question, why do some of the opens to not align flush with the previous close? Any insight would be greatly appreciated.
Sometimes the next candle is "detached" from the previous one because there is a "gap" in the price. It can happen when there is news coming out, or earnings results for companies. You can look at the IBM daily chart in the platform as an example.
Trading 212 thankyou that makes sense
Very useful video... kindly take sideways market examples...to explain
Love love love your channel. I've been trading FOREX since '09, and crypto since 2016, and I still learn something from every video.
Cheers Kyle :)
I'm trying to find out what indicator traders in the European markets use to gauge breadth, fear, greed, of the e-mini in real time. Something similar to NY tick
Hi David, you demonstrated a daily candle with market open and close, high and low, does this apply exactly the same to a lower time frame one minute and upwards?
Hey Rowland and yes - this applies to all time frames.
Yes- a ten minute candle for example would show the H, L, O, C for that ten minute period.
Great vid as always! one question though why didn't you cover the heikin ashi chart or is that gonna be a complete different video? :)
We'll be doing more chart videos, Heikin-ashi is in the pipeline.
Trading 212 Thank you ☺
thanx alot sir what trading books would you recommend for beginners
You may take a look at those - blog.trading212.com/category/book-of-the-month.
Hello;
Thanks for the video, you're great in every way.
It's possible that you go a little bit deeper in these training (Not only in general) ,because you have a lot of knowledge and experience.
For example, how different time views are used (clock, minute, day, ...), ... How do experienced traders and you use this?
Thanks and best regards
We'll be doing a video about time frames in the coming months, stick around.
In my version of the app there are two similar candlestick chart types.
A red and green, and a red and blue. They seem to be giving different information, and I was wondering what the blue one is saying.
The blue is the green. Just a different colour
Great video on the basics, can you do one on the Ichimoku cloud ?
Ichimoku cloud video coming in the next few months, stay tuned.
Daily candlesticks seems designed for markets that opem and close. My gut feeling tells me that they may provide different sentiment visually depending on timezone for 24h/7 markets. Could you please consider preparing educational video " How daily Japanese candlesticks may confuse you in 24h/7 markets" pr similar topic. So I would know what patterns to watch out! Thank you!
That's actually a very interesting idea. 24/7 markets, specifically for cryptocurrencies, are something relatively new. We will consider a video on this topic. In the mean time you could probably use line and bar charts if you think they offer better value for analysing 24/7 markets.
Sir but some time we are watching indicators we not concentrate on candle stick pattern ..how we trade on that situation
Thank you
You can trade on a larger time frame, that way you'll have more time to analyse charts and indicators.
In an ideal situation you would be looking to combine the both for confirmation. So, for example, there is bearish engulfing suggesting a top - if the RSI is also overbought, then some would take that as confirmation
How to know time frame
First Tank you very much for all those top videos
But I have a question, maybe even someone following can explain it to me
How is it possible that the candle closes at one point and the next one opens somewhere else?
Not talking about daily or weekly, traditional markets close at night and on WE, but I really don’t understand how it’s possible on, for example, hourly charts, as soon as one candle closes its the beginning of the next, so how can the price change?!
Probably it’s one of those things that are super obvious but you just don’t see it until someone tells you
Thanks in advance for a good answer
Hello and thanks for reaching out. Every candle represents certain time worth of trading, e.g. a candle on a 1 hour chart time frame represents 1 hour worth of trading. Since the price constantly changes, a gap between the closing price of a candle and the opening price of the next one is perfectly normal to occur. You may want to get in touch over the live chat, should you like to further elaborate on the topic - www.trading212.com/en/Contact?startchat.
Trading 212 not so convinced of this answer
Isn’t at the point where one 1h candle closes the start of the next?!
Like as soon as it changes from 09:59:59 to 10:00:00 the start of the next candle? No gap where a change could occur...
It just doesn’t make sense in my head
But thanks a lot for the response
The gap is formed by the difference between the closing price of a candle and the opening price of the next one. You may also watch this tutorial on the topic - th-cam.com/video/OGFxp3Pixg8/w-d-xo.html.
If you could do a video on what an average day would look like for a day trader I think it would be helpful. Give people an idea of how much time someone would spend Trading and how many currencies or stocks they might follow at once.
That's actually an interesting idea for a video. We've covered part of that over here - th-cam.com/video/DfvNj-3dGuo/w-d-xo.html&t
But we'll think about your suggestion as well.
When using the charts in some cryptocurrency exchanges, sometimes I see candles that are hollow and some that are filled (same colour, green or red), on the same chart. I still have not figured out what that means.
That shouldn't even be possible. There are occasions when a candle can have the same open and close price and be like a cross and lack a green/red colour (or whatever combination was set). But that's the only case when there can be no colouring.
Trading 212 There are some charts that have an option for hollow green/red candies (eg. Bittrex, IIRC) but they are usually one or the other (hollow or filled). What I meant is that sometimes I'll see a few candies that are hollow while most are filled. If I see this again I'll follow up with an image link, but it may simply be a software glitch.
who opens and closes market?
and when to know to be open or closed?
Hi Dejvid, while your first question is easy to ask, it requires a serious elaboration in the answer. You may start a chat, should you wish to discuss the matter with a customer care team member - www.trading212.com/en/Contact?startchat. The market hours for every trading instrument on Trading 212 are available in the trading app's "Instrument details" section, as well as at www.trading212.com/en/Trading-Instruments.
WELL DONE ANOLD SCHWAZINIGER
I need a mentor how to pro trader
How many indicators do you need to perform an educated trade
That's entirely up to you. Most traders seem to use between one to three.
Keep preparing me fam.... Because when i am ready am gonna wipe it all 🤣
Bro have you show in coin exchange?
A what in the where?
At coin exchange market bro
These vids are only available on our channel, if that's what you're asking.
Sorry bro I want to how what site are you teaching for this video
Can you tell me why sometime chart up but the price donw
Bro.. make videos about all parameters (ex. rsi...)
Hi Narender, you may want to take a look at this video about the RSI - th-cam.com/video/rgVdgR1y1Dg/w-d-xo.html.
I have made a lot of profit through forex
candlestick and bar charts are absolutely awful if youre day trading