could you answer me on this question plz: i want to highlight top 3 in pivot chart with every drill down is that possible ? thank you for all your information you sharing🤗
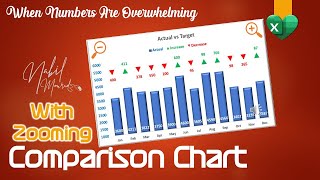
So many great tips in this video PK: Using error bars to show movement arrows, adding + and - signs to the data labels, SUMIFS on check box outputs to create the chart data. Great video 👍
Thank you PK Sir. Your videos are very innovative very interesting, I have personally learnt many new things . For the above chart please show us how to have more than two years comparison for e.g Sales from 2010 to 2019 with + and -ve conditional formatting. There is a video by Excel Campus Jon "Column chart that displays percentage change in excel Part-1,2,3. But he has not explained it the way you explain. Hence I request you to please post a video or send me a link explaining in your easy to understand simple style.
Great help sir... Since I had 16 markets, so I used support column True/False (using vlookup formula) in data sheet instead of doing sumifs 16 times Thanks
Hi PK sir, this is very useful. Can you please advise on "how can we insert the dynamic chart with the selection buttons in PPT". it will help us if we choose the button, we can see appropriate data.
Hi Sir, Great session. Thank you. I need your help on one point: If we have 0 value in last year then what will be the edited formula? =+IF(ISERROR(F11),"","+" & TEXT(F11/B11,"0%")) Actually, I am getting "#DIV/0!" output if i am entering the 0 value in last year.
Hi bro I understand a little english but I don't speak, and I write to you using a translation for you, and I hope that you will understand me. thank you for this video and for all your videos, they really help us in our work, and at the same time, they are wonderful formations my request it is if possible, to make us this same example for this graph but for a comparison between three years example 2018/2019/2020, of which the last year (2020) is the reference year
Hi, thanks for the insights, how can we make the variance arrows stick out clearly. Have watched and tried but I am getting this. Any idea on where I am going wrong. Thanks. Variance arrows are inside the primary column bars. How do I position them on top?
PK Sir, My friend is looking for a Excel Expert person in Mumbai, u must be interacting with many,if you come across any person please let me know..Job is in Reputed Company in Mumbai Thanks
I feel there is a mistake in your Chart because Jan to March 2017 is less than 2018, but the error bar (black) shows up, why it should be down. Could you please explain.
Dear Sir, Great Knowledge in excel & also Thank you sir. We are create & management like the this things data for check box tik. I was updating next month data Graphs & number but month is not featuring. Please help us.
Bhai saab, first of all you should simply tell how to show difference of two bars in simple format and then you should add multiple counties data. Make video again.
Hi Sir, Thank you, understood very well. can I know how can I add the states/zones under india by giving one more check box or drop down so that we can see Indian which states/zones has done how much sales
Excellent PK Sir!!! Just a question is it feasible to create similar chart with Pivot Data or is there any alternative incase if we are using Pivot Data
when i'm copy the formula and pasting it after making required changes, it is giving me the result as #VALUE!. i'm putting the right formula, still it is giving the same result. it is working fine if i'm selecting only one state. but when i'm adding other countries it is repeatedly giving me value error. what colud be the possible reason for this
The next brilliant movie about excel and analysis on the charts. One of the best websites combining Excel functionality with creating management information in the company
Hi. Thank you for this awesome video. I was able to use it to compare my actual amounts to my budget amounts but now I need to incorporate the prior year and I'm having a little bit of trouble getting my arrows to work. Can you help me with this? Thank you.


Brilliant!!! Thank you very much 🙏🙏🙏
You're most welcome!
PK Sir! You’re certainly an expert and how simplistically you teach is highly appreciable.
Thank you! 🙏🏻
- Gaurav
Thanks for your valuable feedback
It's great videos. I have learned lot of things in this video. Thank you
Thanks for your valuable feedback🙏
Thank you so much, this is really creative! I'm so glad I found your video!
Thanks PK ji, your each tutorial video refreshing my Excel knowledge. Master piece of work. Amir
Thanks for your valuable feedback
Thank you so much,Sir .you are brilliant.God bless you
could you answer me on this question plz:
i want to highlight top 3 in pivot chart with every drill down is that possible ?
thank you for all your information you sharing🤗
This is an awesome dynamic chart sir....great work 👏👏👏👏👏👏
Thanks for your valuable feedback
Great job! Thanks for sharing
Thanks for your valuable feedback
Simplemente genial, muchas gracias PK
Thanks for your valuable feedback
Very good pk.
As usual always new creativity..
Very useful
Thanks for your valuable feedback
Thank you sir for sharing your talents. I'd like to create this elegant chart for forecasting vs actual for my teams. What do you think?
Thanks for your valuable feedback. Definitely, this chart will work for Forecast vs actual also.
Thanks PK - it was super
Thanks for your valuable feedback
Mashallah,good for excel path.
And it can be connected to data model??
So many great tips in this video PK: Using error bars to show movement arrows, adding + and - signs to the data labels, SUMIFS on check box outputs to create the chart data. Great video 👍
Thanks for your valuable feedback
Thank you PK Sir. Your videos are very innovative very interesting, I have personally learnt many new things . For the above chart please show us how to have more than two years comparison for e.g Sales from 2010 to 2019 with + and -ve conditional formatting. There is a video by Excel Campus Jon "Column chart that displays percentage change in excel Part-1,2,3. But he has not explained it the way you explain. Hence I request you to please post a video or send me a link explaining in your easy to understand simple style.
good one but don't you think this needs lots of effort and time while we can do it using conditional formatting
how can we add dynamic chart title in this chart for example by selecting INDIA* chart title shud be Sale comparasion of India or whatever ??
So instead of adding year, I will use q1 and q2. How to add q1 q2 q3 and q4 and show that variance with arrow mark? Any guidance plese
How to add this in ppt in editable format... please guide
Sir very nice video sir
Thanks
Great help sir...
Since I had 16 markets, so I used support column True/False (using vlookup formula) in data sheet instead of doing sumifs 16 times
Thanks
Thanks for your valuable feedback. You can use slicers in place of check boxes. I will explain in my next video
I didn't understand why you going speed lesson? That's unuseful
Thank you, PK, no words it is great to work!!! Amazing your video!!! Always news!!!
Thanks for your valuable feedback. Request you to please share this with your friends and colleagues.
What if we have data for more than 2 years and we want to create variance bars between the years?
when i click on Max left and use the plus sign the Error bars dont come up
Tried to follow and create step for step. Not working
how to do this with target? mine mixed up because i have target
How would this work with just one year of data instead of 2
Do you have the same graph with 3 years comparison.
This video helped me to analyse data. Thank u so much uploading this video
Thanks for your valuable feedback
Hey This is Great. How can I contact you ?
Hi PK sir, this is very useful. Can you please advise on "how can we insert the dynamic chart with the selection buttons in PPT". it will help us if we choose the button, we can see appropriate data.
Hi Sir,
Great session.
Thank you.
I need your help on one point:
If we have 0 value in last year then what will be the edited formula?
=+IF(ISERROR(F11),"","+" & TEXT(F11/B11,"0%"))
Actually,
I am getting "#DIV/0!" output if i am entering the 0 value in last year.
How to do the same for 3 years. Pl post a video on it
Can we do it in power bi. Pls reply
Where do these people come? 😂😂😂
too difficult so understand
can't we put check boxes on chart ????
Amazing job. can we do the same dashboard with filter options
Yes we can do that.
Can we make it with combo box
Wow it's great helpful for me
Thanks a lot for video
Thanks for your valuable feedback
Absolutely amazing job! Great explanations and very very elegant work.
Thanks🙏
Hi bro
I understand a little english but I don't speak, and I write to you using a translation for you, and I hope that you will understand me.
thank you for this video and for all your videos, they really help us in our work, and at the same time, they are wonderful formations
my request it is if possible, to make us this same example for this graph but for a comparison between three years example 2018/2019/2020, of which the last year (2020) is the reference year
Hi, thanks for the insights, how can we make the variance arrows stick out clearly. Have watched and tried but I am getting this. Any idea on where I am going wrong. Thanks. Variance arrows are inside the primary column bars. How do I position them on top?
I was looking for that for a long time thank you MR Excel Expert
Glad it was helpful!
PK Sir, My friend is looking for a Excel Expert person in Mumbai, u must be interacting with many,if you come across any person please let me know..Job is in Reputed Company in Mumbai
Thanks
The video sound is pretty good, beyond my imagination
Thanks for your valuable feedback🙏
I feel there is a mistake in your Chart because Jan to March 2017 is less than 2018, but the error bar (black) shows up, why it should be down. Could you please explain.
Dear Sir,
Great Knowledge in excel & also Thank you sir. We are create & management like the this things data for check box tik.
I was updating next month data Graphs & number but month is not featuring. Please help us.
Bhai saab, first of all you should simply tell how to show difference of two bars in simple format and then you should add multiple counties data. Make video again.
It's valuable to invest time in watching your videos. Thanks
It's my pleasure
This is so great !!! Thank you so much , you are an expert indeed.
If I am using Excel 2010, how to apply cell values to the data label? i could not find this option in this version
Hi Sir, Thank you, understood very well. can I know how can I add the states/zones under india by giving one more check box or drop down so that we can see Indian which states/zones has done how much sales
Yes you do it. Or you can add the slicers also
Hi, Which excel you had used as am not able to find developer tab
Watch the below given video
th-cam.com/video/q8AZ2TGbY7M/w-d-xo.html
@@PKAnExcelExpert thanks a lot sir .got it at right time
Hi, Can we do that with Google Sheets Because I am not finding some error bar options in Google sheets
Pk, Thank you. Very useful chart
Great excel knowledge
Thanks for your valuable feedback
Excellent PK Sir!!! Just a question is it feasible to create similar chart with Pivot Data or is there any alternative incase if we are using Pivot Data
Thanks for your valuable feedback. Yes it is possible. I will definitely try to make such video.
@@PKAnExcelExpert Thanks for your prompt response n effort.. Appreciate it n will wait for ur video 😊👍
when i'm copy the formula and pasting it after making required changes, it is giving me the result as #VALUE!. i'm putting the right formula, still it is giving the same result. it is working fine if i'm selecting only one state. but when i'm adding other countries it is repeatedly giving me value error. what colud be the possible reason for this
Please recheck the formula or download this excel file from the link given vedio's description box. You can see the formula there
The next brilliant movie about excel and analysis on the charts. One of the best websites combining Excel functionality with creating management information in the company
Thanks for your valuable feedback
Very thanks. I have question. Can you give me a tip to make 3 years chart, like this shape?
Great sir....thank you sharing your knowledge....
Thanks for your valuable feedback
Excellent imagination sir
Thanks for your valuable feedback
Just used it for a report, you are a genius ! I dont know how you figured out this thing but it works wonderfully thank you
Thanks for your valuable feedback
MAESTRO!!!
What is the shortcut key at 6.30 to select the whole column ?
nice!! can I input this to PPT and it will also auto generate values with the tick box?
Such a brilliant and helpful video thanks a mill, I just did a report with creating similar graph
You are amazing. Thank you brother
Thanks for your valuable feedback
thank you, great chart
Most welcome
Salute to your teaching style
Thanks🙏
Perfect 👍 as always you are genius Sir..
Thanks for your valuable feedback
Pk ji
Can We add data of year 2019
Your each lesson is simply superb .. I really like your way you explain the process
Thanks for your valuable feedback
Hi in my excel there is no + button near the chart pl help
You are too fast ? all the same nice work
Thanks for your valuable feedback. I will take care in the upcoming videos.
I loved this video. Thank you Sir !
Thanks for your valuable feedback
CAN WE ADD DROP DOWN LIST OF YEARS IN THIS CHART?
Wowww Excelente trabajo !!! Gracias por todo
Thanks for your valuable feedback
Hi. Thank you for this awesome video. I was able to use it to compare my actual amounts to my budget amounts but now I need to incorporate the prior year and I'm having a little bit of trouble getting my arrows to work. Can you help me with this? Thank you.
Beautiful. Thanks for the share.
Thanks for your valuable feedback
you are a legend💪
Thanks🙏
As usual always Very useful chart
Thanks for your valuable feedback
çok iyi çalışmalar
Excellent Bro
Thanks for your valuable feedback
Thanks
Welcome
This is awesome! Thank you!
Thanks for your valuable feedback
Ask : can i copy chart & change source
Cause when i do that the error value cannot made same axis between primary & secondary
You are great sir
Thanks 🙏
excelllent
Thanks for your valuable feedback
Thanks PK for the good presentation, is there a way I can show my labelling percentages to 1decimal place? Many thanks.
Excellent work,
Thanks for your valuable feedback
I Loved this video
Thanks for your valuable feedback
@@PKAnExcelExpert 👏👍💐
awesome
Thanks for your valuable feedback
Your too awesome to be true! Ty
Thanks for your valuable feedback
Thanks for your valuable feedback
Thanks a lot!
Amazing. Thank you. Love your educational videos
Thanks for your valuable feedback
Bravo!!!