TH-cam
US
How to Estimate Pore Water Pressure in Undrained Triaxial Tests on Clay
9:26
What is a Response Spectrum Analysis? and How to use it in Seismic Design of Structures?
12:59
How to Understand Earthquake Seismic Records | Examples Explained earthquake #engineering #education
7:05
กินขนมมั้ยจ้ะน้อง หนมน้า😝
00:35
ถ้าทาสไม่ขุดทอง แล้วทาสจะขุดอะไร #hererm #เกม #gaming
00:46
หมวกกันน็อค - TaitosmitH |Official MV|
04:38
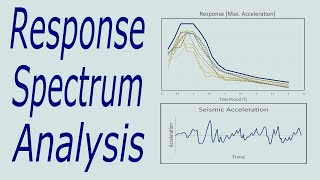
Understanding Acceleration Response Spectrum of 2023 Turkey Earthquake and Building Stability
Soil Mechanics and Engineering Geology
ติดตาม
128K
ดาวน์โหลด
โหลดลิงค์.....
มุมมอง 12 399
0
0
เพิ่มลงใน
เพลย์ลิสต์ของฉัน
ดูภายหลัง
แชร์
แชร์
ฝัง
ขนาดวิดีโอ:
1280 X 720
853 X 480
640 X 360
แสดงแผงควบคุมโปรแกรมเล่น
เล่นอัตโนมัติ
เล่นใหม่
เผยแพร่เมื่อ 2 ก.พ. 2025
ความคิดเห็น • 8
ต่อไป
เล่นอัตโนมัติ
9:26
How to Estimate Pore Water Pressure in Undrained Triaxial Tests on Clay
Soil Mechanics and Engineering Geology
มุมมอง 12K
12:59
What is a Response Spectrum Analysis? and How to use it in Seismic Design of Structures?
Dr Nafie - Structural Engineering
มุมมอง 125K
7:05
How to Understand Earthquake Seismic Records | Examples Explained earthquake #engineering #education
Soil Mechanics and Engineering Geology
มุมมอง 2.2K
00:35
กินขนมมั้ยจ้ะน้อง หนมน้า😝
Eoirndaime
มุมมอง 307K
00:46
ถ้าทาสไม่ขุดทอง แล้วทาสจะขุดอะไร #hererm #เกม #gaming
Hererm
มุมมอง 82K
04:38
หมวกกันน็อค - TaitosmitH |Official MV|
GeneLab
มุมมอง 309K
00:17
Mache leckere Lutscher mit diesem PRO-Gadget! 🚽🍭
Chill Thesoul Out German
มุมมอง 8M
27:34
Seismic Analysis of Multi-Story Buildings using the Response Spectrum Method
Dr Nafie - Structural Engineering
มุมมอง 68K
21:17
Generating a Response Spectrum from acceleration time history
Structural Madness
มุมมอง 14K
5:32
Buildings in Earthquakes: Why do some fall and others don't? (educational)
IRIS Earthquake Science
มุมมอง 159K
17:44
Etabs 2015 - Response Spectrum Analysis
Civilknowhow Tutorials
มุมมอง 153K
19:52
Inside the V3 Nazi Super Gun
Blue Paw Print
มุมมอง 2.9M
18:16
Unit 6.3: Earthquake Response Spectra: Design Spectra
VIBEs Lab
มุมมอง 8K
17:25
ETABS - 22 Response Spectrum Analysis: Watch & Learn
Computers and Structures, Inc.
มุมมอง 146K
1:20:21
07 EUROCODE 8 DESIGN OF STRUCTURE FOR EARTQUAKE RESISTANCE BASIC PRINCIPLES AND DESIGN OF BUILDINGS
Inženirska zbornica Slovenije
มุมมอง 34K
10:01
Performing Response Spectrum Analysis Using Ansys Mechanical - Lesson 1
Ansys Learning
มุมมอง 24K
00:18
ใครขยับไม่ได้เป็น!!
DOME TTP
มุมมอง 21K
00:18
#JasonDeruloTV // Funny #GotPermissionToPost From @SofiManassyan #SlowLow
Jason Derulo
มุมมอง 14M
01:00
แพนด้าจะไม่ทน #cartoon #cartoonnetwork #short
MuTun Ch
มุมมอง 19K
03:08
ไฮไลท์การแข่งขัน สิงคโปร์ 2-4 ไทย | ฟุตบอล ASEAN Mitsubishi Electric Cup™ 2024
Thairath Sport
มุมมอง 147K
00:26
Cool Items!🥰 New Gadgets, Smart Appliances, Kitchen Tools Utensils, Home Cleaning, Beauty #shorts
Cool Items Official
มุมมอง 8M
2:55:01
LIVE🔴 : Singapore vs Thailand | ASEAN Championship 2024 | 17.12.24
BG SPORTS
มุมมอง 2.5M
33:05
เซอร์ไพรส์ซื้อรถคันใหม่ให้พี่หน่อง! ไม่ต้องทนขับรถเก่าอีกต่อไป ขับมาอวดจนพ่อหมั่นไส้
Ozrealman
มุมมอง 342K
2:00:01
ผู้หญิงแต่งงานกับขอทาน แต่กลับถูกดูหมิ่น ในที่สุดชายขเทานก็เผยตัวตย#ละครหวานๆ#ชอบ
Chaiyo sweet TV
มุมมอง 304K