How To Create A Tableau Dashboard: Filters Across Sheets

ฝัง
- เผยแพร่เมื่อ 25 ส.ค. 2024
- Read more about how to create a dashboard for data science and data analysis here:
championanalyti...
When doing data analysis you want to discover insights quickly!
You also want to communicate your insights to you business user in the best way possible.
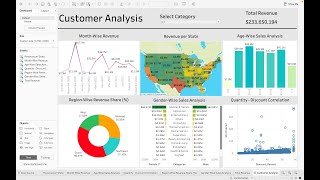
Creating a data dashboard is a great way to show your insights visually to your business user.
In this video on how to create a dashboard you will learn:
- How to create a user interactive filter
- How to display your filter
- How to change your filter to a different format
Watch the next video (Section 5A) to find out how to complete your dashboard!
![Tableau Actions [Overview of all 5 Tableau Dashboard Actions]](http://i.ytimg.com/vi/jdpnOaZM31Y/mqdefault.jpg)
![Tableau Actions [Overview of all 5 Tableau Dashboard Actions]](/img/tr.png)


Just throwing this out there - I am sure a lot of people love the slow response, but what I really need is a 60-second video showing your screen clicking through the steps of getting this done! Maybe you could be the guy to have both the long video and a link to a short video that solves the same problem.
I used the same concept to help me with a highlighting issue. Very helpful video!
People like u r the life saver for us. ♥️
Thank you for sharing!!!!
Very Helpful. Exactly what I was looking for.
Like the content and the pace 👍
Very well demonstrated. Thank you. But is there a way where the target worksheet will not automatically pop up?
when you create the action, there are 3 options "select", "hover", and "menu", if you choose "menu" then it won't pop up automatically, you have to use the right-click menu to go there
Good quick video - I learned sometthing
Is there a way that a chart is hidden/show based on filter value selection?
Really useful and got me started. Do you know if it's possible to do the opposite (sort of). If I select 'central' in sheet 1, then can I *not show* (exclude) 'central' and only show the others (exclude central). I'm trying to do something similar and take the selected "profit' of "central" and use that to calculate the %age difference in sheet 2 for other areas. Thanks
Jason Bailey - not sure but I’ll investigate and comment back. Thanks for the comment!
OK Jason - sorry for the delay. I'm trying to follow along with what you are trying to do. One quick way to do this is to put a "Region" filter on Sheet 1. Click the drop down for this new "Region" filter and hover your mouse over "Apply to Worksheets". In this sub-menu click "Selected Worksheets". Check off your Sheet 2 worksheet which should be your profit worksheet. Now in Sheet 1 you can Right Mouse Click the central region bar and click "Exclude". This will show all other regions except for Central in both Sheet 1 and Sheet 2.
Is that what you were trying to do?
Apologies for late reply. Holiday! Yes thank you. This is part of the solution. The extra was use of a FIXED level of detail based on a parameter. Thanks for helping out.
useless I need create a filter which would be displayed in Dash, that's it, but he doesn't show that. why to name your video like this if you don't deliver