@@joshemman No problem. I'm taking my IB business exam in 4 days, this definitely helped as I was confused how exactly to plot the TR and TC lines according to the figures but now i know that its just as simple as making sure they intercept the BEP and start from the appropriate y-axis coordinate!
I was in need of this Break Even Chart explanation for my presentation and now I feel relieved that i watched this video☺.. Thank you so much for the video
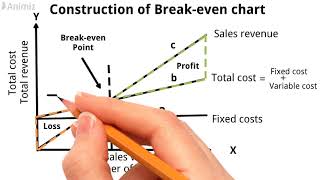
Variable cost is indeed represented on the break-even chart, but not as a separate line. It is incorporated into the Total Cost line. To visualize the variable cost component, imagine shifting the Total Cost line downward until it intersects with the origin (0, 0). This shifted line would represent the variable costs alone.
Dear Friends, I want to confirm: If a company has passed the break-even point, why should we do variable costs minimums and maximum fixed costs then the profits will increase more?. Thank you.


Constructing Break Even Chart in Excel: th-cam.com/video/oiCvg9bZJso/w-d-xo.html
how did you get 45 i dont see it I see 60-25 = 45
that dosent make semse 60-25 is 35
@@martinkeogh2090 (1575)/(60 - 25) = 1575/35 = 45
omg. You actually dusted off a full topic in under 2 minutes! Bravo. Thanks
Rarely comment on videos but thank you for making this so easy to understand in such a short time! Learnt more from this than a 1 hour lecture.
Thanks for dropping a note, Titus.
@@joshemman No problem. I'm taking my IB business exam in 4 days, this definitely helped as I was confused how exactly to plot the TR and TC lines according to the figures but now i know that its just as simple as making sure they intercept the BEP and start from the appropriate y-axis coordinate!
Wish I had known you sooner, your videos are straight to the point and yet still very informative and easy to capture. Thankyou..!!
Excellent! I've watched about 10 of these Break Even Analysis videos and this is the clearest and also one of the shortest ones! Love it!
Broooo u are amazing u just summarized everything in 2mins
My teacher couldn't tell this properly in 2hrs
Thank you! Hope you have a great year.
oh my god, just almost 2m and I understand what you are saying. Thanks
this is the best 2 minute video out there no cap
I'm glad you're back to making videos! You explain stuff so well, keep it up!
You seriously have some skills.
Thankyou so much
You are an absolute legend, i was stressing cos i didnt know how to do it until i found this video
U fool he doesn't make us understand it fully atleast to a person not having the actual concept
I was in need of this Break Even Chart explanation for my presentation and now I feel relieved that i watched this video☺.. Thank you so much for the video
ive been doing this for hours and then found this video. Thank you so much
omg thank you so much, looking for a good video for ages and this was so quick and easy!!
Without you I would’ve failed my homework, thanks and keep up the great stuff!
This was amazing I completely understood it in such a short time, wish you were my uni lecturer lol!
this is absurdly short and more than helpful. thank you so much
My pleasure, Nik.
the goat. got an exam in less than an hour
Hope your exam went well.
The clearest explantion so far and easy to recall. Well done Joshua.
that was so quick, and understandable. Just spent 2 hours explaining what u explained in 2 minutes
This was a great video that I have shared with my Intro students in Grade 10. Will check out your channel. Thank you.
Thanks, Bradley.
This is the best explanation ever
Wow,... Such a wonderful video.. I must say I enjoyed it and it's excellent...
so much more helpful than my business class, tysm
Thank you so much. Will help for my exam on Friday.
amazing dear❤ love from Bangladesh ❤ you just rocked it within 2minutes.🎉
Thanks, Shafiul.
The easiest, most efficient tutorial on how to break even analysis works! 😀
Glad it helped!
short and simple easy to help my dumb brain lol thanks . much easier to understand than my revision book
Thank you so much. My homework is now done.
Thank you very much for this, I've been having problems understanding my teacher due to the language barrier.
Thank you very. It is really straight to the point. It helped me a lot.
gosh... that guy just summarized the entire topic in 2 min but my professors just tried to teach it for 3 hours :D
After watching this video I was like "wow wow, nice and short"❤😂
Wow wonderful video 😮❤
Thanks 🤗
great video and so easy to understand! thank you!!!
Its soo simple and easy to understand. Thanks a lot!!
What . It took more than a hours in our class even we didn't understand but you just nailed it within 2min 🤣🤣😅😱
Thank you sir, amazing video😄
Thank you very much! You explained it very clearly and briefly :D your video helped me immensly!
bro you are a godsend
Great explanation. Thanks.
THANK YOU SO MUCH! THIS HELPED ME A LOT.😊
very well explained
Omg thank you so much I understand!!
absolute mad lad solved my doubts in 2 minutes!
Best explanation ever
Thank you very much
absolute lad explained it well cheers
Very good video bro. Liked and subbed
Yeah bro totally agree
Thank you very much God bless you
God bless you too, Timothy.
Good video my brotha
This is beautiful.
Thanks helped for my exam
Glad to hear. Thanks for dropping a note.
Thanks very much, this is simpler to understand.
what about the margin of safety?
I wish I could give you 10 likes in this simple vedio
Thankuuu…this helped so much😊😊😊
Most welcome 😊
Good job
Thank you so much, this helped me so much!
Great teaching! Thanks a lot!
Thanx for clear explanation
wow.... you are amazing. thank you!
Thanks it was easy to get😊
Thank u so much
You really saved me ❤️
OMG just 2 minutes can quickly learn BEP 💯
this was so helpful, thank you
Thank you very intellectuals
Glad I watched this
Hi sir, could you do a multiplicative forecasting tutorial? With the deseasonalized steps as well.
Superb ✌️
Legend man thanks so much
Sir why is variable cost not represented on the graph?
Variable cost is indeed represented on the break-even chart, but not as a separate line. It is incorporated into the Total Cost line. To visualize the variable cost component, imagine shifting the Total Cost line downward until it intersects with the origin (0, 0). This shifted line would represent the variable costs alone.
Damn bro i have my test tomorrow ,
Thank you so much
You're most welcome
great video
Thanks for the visit
Short simple efficient.
How to find vc line???
How to make this graph on powerpoint?
Dear Friends, Could you write the formula of EBITDA breakeven?. Thanks.
EBITDA = 0
@@joshemman , it mean is revenue=COGS, right?
is this break even chart in annually? or what?
Thank you so much.
thanks teach !!!
Hi, how make this in excel.
See if this video helps. You can start around the 8th second.
th-cam.com/video/pQp4GZfoxTo/w-d-xo.html
@@joshemman thank you so much
Thanks alot brother
Happy to help
Straight forward thanks
O M G
Thank you so much
helpfull sir
🙏
Thank you so much!!
THANK YOU!
Anyone watching this before their paper 👀?
Thank you so much
Dear Friends,
I want to confirm:
If a company has passed the break-even point, why should we do variable costs minimums and maximum fixed costs then the profits will increase more?. Thank you.
The contribution should be $35 and not $45. 1575/45=35. hence 60x35=2100, so breakeven point 2100?
Bless you, Rose Patrick. 🙏
Sorry but I didn't understand 🥺how come 60-25 is 45 but dividing ith with 1575 is 35 u took 45 itself can you explain
At 0:11
60 - 25 = 35
1575/35 = 45
THANKS!!!!
THANK YOU SO MUCHHHHHHH
Thanks chief
Thanks very much 😃
thaanks so much !!!
You're welcome, Aarav.
Thanks a lot
Thnq so mucj sir