SPSS Questionnaire/Survey Data Entry - Part 1

ฝัง
- เผยแพร่เมื่อ 20 เม.ย. 2014
- How to enter and analyze questionnaire (survey) data in SPSS is illustrated in this video. Lots more Questionnaire/Survey & SPSS Videos here: www.udemy.com/survey-data/?co...
Check out our next text, 'SPSS Cheat Sheet,' here: goo.gl/b8sRHa. Prime and ‘Unlimited’ members, get our text for free. (Only 4.99 otherwise, but likely to increase soon.)
Survey data
Survey data entry
Questionnaire data entry
Channel Description: / statisticsinstructor
For step by step help with statistics, with a focus on SPSS. Both descriptive and inferential statistics covered. For descriptive statistics, topics covered include: mean, median, and mode in spss, standard deviation and variance in spss, bar charts in spss, histograms in spss, bivariate scatterplots in spss, stem and leaf plots in spss, frequency distribution tables in spss, creating labels in spss, sorting variables in spss, inserting variables in spss, inserting rows in spss, and modifying default options in spss. For inferential statistics, topics covered include: t tests in spss, anova in spss, correlation in spss, regression in spss, chi square in spss, and MANOVA in spss. New videos regularly posted. Subscribe today!
TH-cam Channel: / statisticsinstructor
Video Transcript:
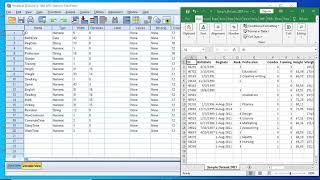
In this video we'll take a look at how to enter questionnaire or survey data into SPSS and this is something that a lot of people have questions with so it's important to make sure when you're working with SPSS in particular when you're entering data from a survey that you know how to do. Let's go ahead and take a few moments to look at that. And here you see on the right-hand side of your screen I have a questionnaire, a very short sample questionnaire that I want to enter into SPSS so we're going to create a data file and in this questionnaire here I've made a few modifications. I've underlined some variable names here and I'll talk about that more in a minute and I also put numbers in parentheses to the right of these different names and I'll also explain that as well. Now normally when someone sees this survey we wouldn't have gender underlined for example nor would we have these numbers to the right of male and female. So that's just for us, to help better understand how to enter these data. So let's go ahead and get started here. In SPSS the first thing we need to do is every time we have a possible answer such as male or female we need to create a variable in SPSS that will hold those different answers. So our first variable needs to be gender and that's why that's underlined there just to assist us as we're doing this. So we want to make sure we're in the Variable View tab and then in the first row here under Name we want to type gender and then press ENTER and that creates the variable gender. Now notice here I have two options: male and female. So when people respond or circle or check here that they're male, I need to enter into SPSS some number to indicate that. So we always want to enter numbers whenever possible into SPSS because SPSS for the vast majority of analyses performs statistical analyses on numbers not on words. So I wouldn't want and enter male, female, and so forth. I want to enter one's, two's and so on. So notice here I just arbitrarily decided males get a 1 and females get a 2. It could have been the other way around but since male was the first name listed I went and gave that 1 and then for females I gave a 2. So what we want to do in our data file here is go head and go to Values, this column, click on the None cell, notice these three dots appear they're called an ellipsis, click on that and then our first value notice here 1 is male so Value of 1 and then type Label Male and then click Add. And then our second value of 2 is for females so go ahead and enter 2 for Value and then Female, click Add and then we're done with that you want to see both of them down here and that looks good so click OK. Now those labels are in here and I'll show you how that works when we enter some numbers in a minute. OK next we have ethnicity so I'm going to call this variable ethnicity. So go ahead and type that in press ENTER and then we're going to the same thing we're going to create value labels here so 1 is African-American, 2 is Asian-American, and so on. And I'll just do that very quickly so going to Values column, click on the ellipsis. For 1 we have African American, for 2 Asian American, 3 is Caucasian, and just so you can see that here 3 is Caucasian, 4 is Hispanic, and other is 5, so let's go ahead and finish that. Four is Hispanic, 5 is other, so let's go to do that 5 is other. OK and that's it for that variable. Now we do have it says please state I'll talk about that next that's important when they can enter text we have to handle that differently.


You sir, are amazing. Saved thousands of half dead students’ lives. You deserve the Nobel peace prize. I’m not exaggerating. I hope you live long and prosper.
haha
😂😂dead students. But its true. Really am dying with several doubts
I really couldn't agree more
🤣🤣🤣🤣
frfr
Without the help from this video, I wouldn't have been able to complete my independent research. This has been INCREDIBLY helpful, and it has reduced my stress with this project IMMENSELY. Thank you, SO MUCH for creating this video!!
Terrific! As a beginner, I've grasped the basics. Thanks
I watched all videos in this series and they were excellent. Easy to understand, clear and at a very good pace. This is the first time I'm going to use SPSS and I'm really very grateful to you for making me understand. I feel like I had a magic! Thank you SO much :)
I was about to trade my soul until my friend slided link of this video into my messenger. SIR, THANK YOU SO MUCH! You've easily and successfully taught me how to use SPSS less than an hour! I literally watched all spss data entry videos. I can now work my thesis confidently. *Graduating this November
Can you please help me where to find a free version of SPSS? I need to work on my thesis too
@@inacala8864 maybe you can ask your school. Maybe they can give you spss for free. If not, I mean spss isn't expensive and a very great tool for your thesis. Other than that, I don't think that you can get spss for free. Good luck on your thesis.
This is a good series for SPSS!!!! I love it. Thank You Quantitative Specialists!!!
*****
Thanks for letting me know, Raymond - I appreciate it!
QS
The best lecture i have so far taken for SPSS... THANKS
That's what i was looking for ages, thank you soooo much!
I have been searching everywhere for someone like you! Thank you!
pure and simple , we really appreciate your sacrifice sir. thank you
you are truly changing the world by your tutorials, am schooling here
Sir you are amazing I watched many videos on TH-cam but you opened my mind on SPSS thank you sir
this helped me so much with my bachelor thesis, thank you so much for making this video
helped me like a teacher from heaven
Thank you for this walkthrough! Do you have any tutorial explaining how to calculate prevalence and its 95% confidence intervals by using SPSS? For comparison between groups (eg, male vs. female) which statistical test can I use to identify the statistical difference between prevalences?
thank you! great video, you helped me a lot!
thank you so much for literally saving my life!!!!!
We are grateful sir for sacrificing your time and effort, God bless you really🙏
explained in a very simple and easy way . Liked it
thanks so much ,My work as been made easy with few minutes
Thanks a lot for these efforts. Very easy and explanatory.
You are a great teacher,thanks and love!!!
Thank you sir.you'r explanation is very clear and understandable.....
Finally! A video that i understand!
You tutorial is excellent, Sir! Expect more details (e.g. why string, why 25 characters, What about __________) It's very helpful.
Excellent tutorial that helped me a lot, Thanks !
great video! I've done this but used "0" and "1" already. could this effect any correlations/results i could expect to see?
Thanks for this simple explanation.
Awesome introduction to questionnaire data entry in SPSS!
+Simon Peter Lokomo
Thanks, Simon!
very nice and informative you have let me free of supervisor request and now i can easily enter my data for thesis
Thank for tutorial Quantitative Specialists. You are a life saver.
Glad to hear it helped, Faridzal!
Mah man, u deserve a medal
it's a very help full ,highly recommended for you guyz
Thank you very much for this class! I realy apreciate it!
My pleasure, Flora. Glad you found it helpful!
Thank you so much.. i have a question .. how can i make results and conclusions from the analysis and my collective method was a survey
These videos have been really helpful thanks. How do I input a vignette from a questionnaire into SPSS? Thanks
Your video has been of immense help to me thanks
+sweta jokhoo
Very glad to hear if helped, Sweta!
very simple explanation!
thanks
Thank you sir. This video is very helpful for beginners like me.
It's just amazing. Thank you from Moroco
simple magic sir.hats off
Thanks for sharing! This help me to learn the first steps. Very clear and easy to folow.
Glad to hear it!
an outstanding amazing video!! thank you so much, it's been of huge help!! the thing i needed most was interview data which is a bit similar to the questionnaire one !! again, thank you so much
+S!M BB
Thanks for the feedback - glad to hear you found the video helpful!
sir, I hope God always bless you in any way of your life. You helped hundred thousands of students! No thank yous is enough T.T
Congratulations
It is very clear explanation 😃 Thank you 🙏
That’s the great learning for me.. thanks Sir,
Thank you for the nice explanation. Would you please provide us with a video about how to enter a pre/post test data in Spss and how to analyse it?
This is amazing! Thank you!
Thank you so much. This video is helpful.
Thank you so much!!!!!!!!!!!!! This was useful
thanks.. its very useful video for the beginners
Wow thank you I understand it well
Used SPSS, both in my undergraduate and postgraduate studies, this statistical software is really easy to use, if you know what you are doing and have read the manual!
this video saved me! thank you so much
Thank you so much for this!
I might get into this!!
Thnx man XD helping us so much for our thesis!:D
Mustafa S
My pleasure, Mustafa. Glad to hear it helped!
This is so much helping to k now data entry in spss what about yes or no questions
Thank for this video
It help me a lot
thank you. if you can please add some detail questionaire which have different items, scales, choices
thank you! liked and subscribed!
With thanks from Nigeria
Great explanation.
How do you enter entries that ask a question then ask for reason for selection? This is one question with 2 parts
Example:
1i. How often have you felt that you have been treated unfairly at the workplace?
a)very often b) often c) not often d) not at all
1ii. What do you think was the reason for this experience?
a) your age b) Your gender c)your race
thank you sir ,good.
Thank you so much.....Thank you!!!
Hello.....can you tell me when we have to enter data in SPSS ,do we have to first divide our research topic into dependent and independent variable?....please reply as soon as possible
thank you so much for this!!!!!!!!!!!!!!
How do I combine 8 different items into one variable, I have used a 24 item questionnaire - a Likert scale of 1-5 score. The questionnaire contains 6 section and each category has 4 questions. How do I go about with the entry.
really helpful! thanks
Hi everyone! can anyone help me with my case as follows: I recently did a training need assessment, now reached data analysis stage but unsure about a thing. Questionnaires have different topics for 4 different types of respondents (i.e. section A applies to respondent type A, section B applies to respondent type B and so on); only training topics are different; while other personal data and training methods apply to all 4 types of respondents. should I use different file (I use spss) to analyze data by type of respondents? If Yes, what should I do with other section for personal data and methods of training as they apply to all types of respondents? I hope to get advice from you. Thanks.
GOD BLESS YOU! 🙏💙
Hello. I am currently using JASP for analysis. How do i do the coding from a google form excel sheet? Thanks.
Thanks for your video.
Brilliant!
Great vedio
very helpful. thanks
Nice
Can you help me in the estimation of Cobb-Douglas production function in SPSS
Nice video...Well summarised data entry lesson....Five stars...
This work is very harad
We are becholr students so first time I use this softwere so now I am confused I dont like and I don't know how tu esaly use this spss
Any body help me I am not understnd how to use spss and how to analyzed data graphs and other data
Is it possible to enter data of more than one option in a single cell and analyze in SPSS. (Example: value 1, 4 in a single cell).
please i need help
how can i use 2sls in SPSS? i need to know the steps. please help
Hello sir ! i m using linkert scaling in my questionnaire 1 to 5 , please tell me procedure how can I enter or code my responses in SPSS. I think your 4-5 questions have scaling method which you didn't describe in this video.
very helpful, thanks
It is a good teacher
what version u use ??
Thanks so much sir. can someone help me understand how the 25 was got when writing the string. am not clear there. thanks
Hello sir..it's really very good video.. please make some more video to analyse and making use of amos..
that's amazingly awesome
Awesome lecture. May I ask, I have 150 questionnaires and I want to enter all those responses and analyze the data using SPSS. Am I suppose to enter all those responses one by one or there is a way of entering frequency of respondents who provided same answer instead. Can someone clarify this for me. Thank you
thanks now i know
good staff. i appreciate
Is this for descriptive statistics
Can you tell me how to find the correlation between two questionnaires?
Thank you, God Blessx
can you upload the questionnaire link here ?
Hi I appreciated your video.
I am looking for help in the use of SPSS to analyze data. I have a data set I wish to subject to a MANOVA. I have 108 individuals’ responses on Likert scales on each question. How do I group the responses into categories? For example, the participants were given a scenario vignette describing human aggression. They were asked, ‘how serious is this situation?’ 1-5, ‘how likely would you be to intervene?’ 1-5.This is repeated for 8 scenarios. I’ve entered individual scores, but how do I get the program to aggregate all of the seriousness scores and average them among the six categories derived from my independent variables? For example did the female participants overall think the scenarios were more serious than the males? Would the males be more or less likely to intervene?
Any help or referrals to a video or site/page that covers this would be appreciated.
Dear sir
Plz share prediction through Neural network, stepwise
THANK YOU! ♥️
i need help , that how i can enter financial data of a company into spss,
suppose i check impact of activity ratio on eps , help me how to enter the data
Quantitative Specialists
Phenomenal Video
Hi which version of spss is this
How can I enter data for the multiple-choice questions?