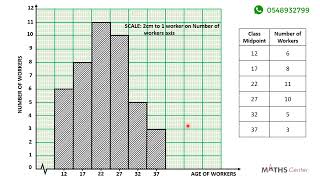
20 Drawing a Histogram for a Grouped Data Question 2

ฝัง
- เผยแพร่เมื่อ 13 ต.ค. 2022
- Maths Center is an Online Core Mathematics Tutorial Series
Follow Maths Center on all our Social Media Handles
TH-cam: / @mathscenter
Facebook: / maths-center-106732728...
Twitter: / center_maths
Instagram: / mathscentershs
Contact us on 0548932799 or 0501360621
#mathematics
#maths
#ghana
#histogram


![ชวนน้องลงทุ่ง - เงาะน้อยเพชรบ้านแพง X น้องมายด์ [ Music Video ] Official Saman Music](http://i.ytimg.com/vi/Bq7Hw9culjE/mqdefault.jpg)


perfect explanation sir thank you
sir for the histogram when will you have to know wether to use class boundary or class midpoint
Thanks
You are too sweet laa sir