i got assigned this video for my statistics class in college. i am absolutely blown away by the fact that YOU ARE FLAWLESSLY AND CASUALLY WRITING ON THE GLASS *B A C K W A R D S*
So glad I found this video! Just started taking statics online this semester. The tally part I was extremely confused about, but now I see it's quite simple. Thank you so much!
Thanks a lot I am a distance learning student with heavy workload and fighting hard to balance studies with work and family matters. My institution provides just one week face to face lecture session in 4 months we are left to do everything by ourselves. This brief lecture session has simplified things for me. Once again thanks a lot
The tally part of this video saved my life. I didn’t know how to find the frequency and thank God I found this video. Thank you for such a clear instruction.
Just perfect - I wanted to learn constructing a distribution table and shows shows up which makes my life so much easier and saved my time searching for a good video to learn the topic.
I wanted to thank you 🙏🏼 without your video I would have never figured out how to get the Tally! Not thru school videos or textbook. You made it all so simple…what a relief!
Very nicely done, clear, ground-up and practical explanation. I think it hits the perfect tone for my lower-division undergrads in ecology and hydrology, who have had varying prior exposure to statistics, but need to plunge into frequency distributions as a first-order analytic task. Thank you for posting the lecture.
This helped me a lot. Thank You So Much. I was crying earlier because i don't understand it during our online class. We don't really have discussions, it's sort of self learning. And i was crying pretty badly. *THANK YOU* I'm from the Philippines btw. And i have subscribed. 💖😍
thank you Amanda ...... even though I didn't attend half of the semester and only watched two videos of you I was good for the half term exams .... thank you
Simple and Clear. I like your handwriting, also how good are you at writing backwards, wow really amazing, and that creative glass so you can face the viewers. Neatly Done!
Hi amanda ..i was struggling with frequency distribution , saw number of videos but all just went bouncing my head ..but your method and video really helped me ..thankyou so much
Thank you so much, I love the content. I just learned this morning about this in class but can't understand well but ths vid tho! Its very understanding and comfortable to learn this way... I hope you have an amazing day.
:D keep up the good work! This came in soo clutch! I needed help studying frequency distribution and this is all (and maybe even) the information I needed!
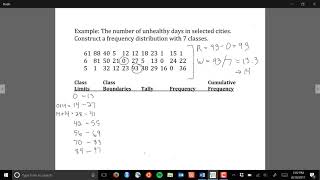
i also tried to do this particular problem on my own, and i noticed that the frequency of the 91-95 should only be 8 and the 96-100 should be 14. I checked multiple times if my answer is wrong, but i think it is right. I watched you again tallying the numbers and I think you forgot to include the 96 and 96 in the lower left, and included it in the limit of 91-95. I don't mean any negative intention, I just want to state it
God i luv this woman...yo tally system made me realize what frequency is n how to construct the frequency distribution table although i wish u explained class boundaries, mid points and relative frequencies
Thank you so much for putting things in such a simple way, I'm confused over one thing (please don't mind if it's a stupid question) Why do you combine the Tally bars in groups of 4? And You wrote 12 in frequency column with the corresponding counting of 8 in Tally and similarly you mentioned 10 in frequency column where Tally was showing 8. Please explain. Regards.
Hi! I want to thank you because this video was really helpful to me for understanding the topic. I have a question, if the lower class limit is 4, then can we take it as 0 in the grouped frequency distribution table?
Hello. Thank you so much. What is the difference between Frequency continuous data and Frequency discrete data and how to solve both of them? Also, what is class rank, Class width and Class boundaries and how will we solve them collectively?


i got assigned this video for my statistics class in college. i am absolutely blown away by the fact that YOU ARE FLAWLESSLY AND CASUALLY WRITING ON THE GLASS *B A C K W A R D S*
Where u at now 🤨
@@mr.bubble2250where YOU at now???
@@conquersnipezyt1618 This was 4 weeks ago😂
@@mr.bubble2250where you at now?
@hdjabs1950 the video is flipped when edited. If you saw the unedited footage it would look mirrored. I love seeing this technique used for teaching.
So glad I found this video! Just started taking statics online this semester. The tally part I was extremely confused about, but now I see it's quite simple. Thank you so much!
Thanks a lot I am a distance learning student with heavy workload and fighting hard to balance studies with work and family matters. My institution provides just one week face to face lecture session in 4 months we are left to do everything by ourselves. This brief lecture session has simplified things for me. Once again thanks a lot
Sm here
The tally part of this video saved my life. I didn’t know how to find the frequency and thank God I found this video. Thank you for such a clear instruction.
Omg ! You made it so much simple and easy to understand. I had a headache at first, but since I stumbled on your video, my headache is gone!
Just perfect - I wanted to learn constructing a distribution table and shows shows up which makes my life so much easier and saved my time searching for a good video to learn the topic.
I wanted to thank you 🙏🏼 without your video I would have never figured out how to get the Tally! Not thru school videos or textbook. You made it all so simple…what a relief!
Thank you so much. I was never able to understand this when my lecturer thought it. You're a life safer, professor.
Very nicely done, clear, ground-up and practical explanation. I think it hits the perfect tone for my lower-division undergrads in ecology and hydrology, who have had varying prior exposure to statistics, but need to plunge into frequency distributions as a first-order analytic task. Thank you for posting the lecture.
Dear Professor Jones, You may never see this but, I am grateful for your explanation.
Thanks a bunch... Your explanation was so simple and elegant.. You're a true life saver 😭😇
This video deserves a great comment.
Thank you for taking time from your day and helping me.
Thank you so much! I finally get it. I couldn’t even understand with the material the teacher is giving us but you made it easy to understand.
I don't know why you have no comments but this is a really helpful video and I'd just like to thank you so much for making it.
This helped me a lot. Thank You So Much. I was crying earlier because i don't understand it during our online class. We don't really have discussions, it's sort of self learning. And i was crying pretty badly. *THANK YOU* I'm from the Philippines btw. And i have subscribed. 💖😍
I can understand but I've got a assignment that my lecture gave it to me but I I'm finding difficult to make it so can you help me?
thank you Amanda ...... even though I didn't attend half of the semester and only watched two videos of you I was good for the half term exams .... thank you
I wonder so many views but not a single comment! Kudos to your efforts! Keep going, and don't stop posting.
amazing video! The most helpful one I have found and I have been watching so many, so thank you Amanda!
Thank you, Madam.
Your explanation is helpful and very easy to understand.
I wish other tutors were also explaining in that manner 🎉❤
BEST VIDEO on youtube explaining frequency distribution! LOVE IT!
5 years later and it's still a big help thanks.
Thank GOD for this video. 🙏🏾 Someone made it understandable for someone who is OBLIVIOUS for this.
Im glad to have gain knowledge from your channel, thanks 🥰🥰
Simple and Clear. I like your handwriting, also how good are you at writing backwards, wow really amazing, and that creative glass so you can face the viewers. Neatly Done!
I love you teaching style i wish my math teacher was like you
I love you cant believe it was that simple thankyou so much
Hi amanda ..i was struggling with frequency distribution , saw number of videos but all just went bouncing my head ..but your method and video really helped me ..thankyou so much
91-95 frequency is 8 and class 96-100 frequency is 14, I deeply appreciate the support prof❤
These is much more simple to understand thank you.
This help.alot when doing my tutorials and assignments🙏
I love how you made everything easy 💯
Your handwriting is magnificent :) love this vid, it helps me alot with my assignment. Have a great day ma'am😍
Informative vedio , I am weak to conduct Tally correctly but by help of this vedio it has been cleared ,thanks a lot keep it up .
The tally method was a savior, the method my teacher teach us was an absolute pain
she taught in a very easy way . thank u so much
Thank you so much, I love the content. I just learned this morning about this in class but can't understand well but ths vid tho! Its very understanding and comfortable to learn this way... I hope you have an amazing day.
Thank you for creating this video!!. It really helped me as I didn't understand in my given learning materials, thank you again!
Thanks! Amazed that you can write from behind so easily.
THE BESST EXPLANATION OF A STATICS CLASS 🎉
Thank you so much! This helped me so much for my math midterm. Wonderful teaching!!!
This video saved my life
Big thanks 🙏❤️
Thank you so much. I finally understand how to find frequency in a class.
This is the coolest one so far
This so much easier than to analyze than the rest of the vids i understood it in one play!
AWESOME! Were doing all this via Excel formulas, seeing it like this helps 10 fold
I loved the way you explained this. Thank you so much.
Thank u so much im on my periodical test and u helped me sooooo much
Thank you ma'am your video helps me for my class test ....thank you very much ..😊☺️
Thank you for this video. It is very helpful especially to a student who is very new to stats!
:D keep up the good work! This came in soo clutch! I needed help studying frequency distribution and this is all (and maybe even) the information I needed!
i could not focus because i was so distracted on her lips LMAO
Ya that's your mom mistake she didn't teach you. Sorry for you 😢
thank you! The tally way is everything!
I love this. Thank you for sharing your knowledge
Thankyou professor you were so helpful today 😍😍 watched it and work on it thanks allot
Your explanation was perfect
Thank you this helped me for my upcoming test.🔥🔥🔥👌
you just saved my life!!!!! THANK YOU
Your video helped me so much! Thank you!!
oh geez god bless this woman . thank you
Thank you Miss Amanda.😊💝
i also tried to do this particular problem on my own, and i noticed that the frequency of the 91-95 should only be 8 and the 96-100 should be 14. I checked multiple times if my answer is wrong, but i think it is right. I watched you again tallying the numbers and I think you forgot to include the 96 and 96 in the lower left, and included it in the limit of 91-95. I don't mean any negative intention, I just want to state it
I thought I was wrong lmao, thank you for this
Yes, you are correct about the tally of the mentioned CI
same i kept freaking out because i can never get the tally the way she did hers!! i thought i was going crazy
Thank you so much this was a very helpful video and your energy is amazing 🤗
You're writing backwards and it's that neat still? Girl you got skill- also thanks for helping me study.
you are the bob ross of math, thanks for making this clear, wish I found this 2 hours earlier!
God i luv this woman...yo tally system made me realize what frequency is n how to construct the frequency distribution table although i wish u explained class boundaries, mid points and relative frequencies
Thank you for this video!!! It helped me understand the concept easily!! Appreciate your content!
Thank you so much this video was so easy to understand. God bless you!
My class was focused on how amazing you are at writing backwards....
Thanks a lot mam Wednesday I have math exam so made my doubt clear and now i am ready for exam
she definately a proffesor she casually going threw topics that my lectureres failed to simplify for me
Thanks for Helping me out
tysm, i alr forgot it but now im glad that i found this video 😭❤❤
That was awesome !
Thanks professor 🦋
Nice video. Easy to understand
Thank you Ms. Amanda
YOUR THE BEST YOU SHOULD NEVER STOP LIFE SAVER
Thanks. I just made aware of something very very important. Thanks again
EASY to Understand ! Thanks for sharing the video
Thank you teacher for your time , It was really helpful.
Thx for this vid it helped me soooo much for my math exam
Very clear and easy to understand. Thank you!
omg I love your handwriting!
great content! however, for the 91-95 value set, there was 8 numbers for it.
otherwise, great video! thanks!
Thanks for this 😊
Thank you so much for putting things in such a simple way, I'm confused over one thing (please don't mind if it's a stupid question) Why do you combine the Tally bars in groups of 4? And You wrote 12 in frequency column with the corresponding counting of 8 in Tally and similarly you mentioned 10 in frequency column where Tally was showing 8. Please explain. Regards.
Amazing think indeed for sharing✔✔💞
Thanks , student from saudi arabia
Thanks for a smooth explanation 🙂
Hi! I want to thank you because this video was really helpful to me for understanding the topic. I have a question, if the lower class limit is 4, then can we take it as 0 in the grouped frequency distribution table?
Your explanation so great
And I, thank you... Literally, thank you...
I love it, very simple to understand!
Numbers remains the gateway to understanding our world
Arigatou maam iloveyousomuch you saved me.❤❤❤❤❤❤
You're amazing, thanks very much ma'am
Still impressed how efficient you could write in backwards 🤯
She taught it very well ! I havee a doubt though , isnt there 12 in 96-100 interval and only 8 in 91-95 interval ?
I wish I could give her a very very big hug 🫡❤️
Dhanyavad for the quick revision. 🙏
thank very much god bless you and your family
Amazing video very clear thank you so much you have helped a lot
Hello. Thank you so much. What is the difference between Frequency continuous data and Frequency discrete data and how to solve both of them? Also, what is class rank, Class width and Class boundaries and how will we solve them collectively?