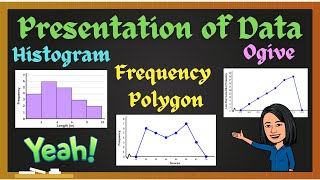
Histogram 1: • Histogram Histogram and Frequency polygon: • Histogram and Frequenc... Cumulative frequency Curve (Ogive): • Cumulative Frequency C... Other statistic topics: • Statistics
Mode is connected to the entire distribution while the mid-value is connected to the class interval of the distribution (grouped data). The data that appears most or with highest number of occurrences (data with largest frequency) is the mode of the distribution. The mid-value of a class interval is the particular data that falls in the middle of the interval. The mid-value is calculated by adding the upper limit and the lower limit and then divide the sum by two.
pls i hv a question from histogram and it is:What if the highest frequency is the last value to be plotted on the graph when you cross the line of the vertex with the previous one plotted before it,since there is no other one to be plotted after it how would you be able to use only one vertex to find the point/line of intersection or would it not be possible?This is my question and i also await your response..
Im watching this right before my exams this afternoon 😮about 4 hours to my paper. And you've explained it so well. Thank youuu so much dear life saver.
I think we use the class boundaries to draw the polygon when it's together with the histogram but when it's to be drawn alone, we use the cumulative mid values
@@nakiryamaria1088 actually we use class boundary to draw histogram when the class intervals are non-continuos data because to draw histogram we need continuous class intervals. And we calculate mid value to draw frequency polygon without the help of histogram.
That is x-y plane and this is not basically x-y plane The frequency axis is labelled 0.5 which means the intersection of f and can axes is not the origin. Okay what will you do if the first Class interval is 41 - 50?
Like man God seriously bless and uplift you Assignment was given improptu and I am in a rush, you're the only TH-camr who went direct and very explainable too God really be with you Thanks so much I'm henceforth a new subbie and I'll always make sure the ads play so u get paid. Well done fr


tomorrow my exam and you helped me Thank you so much
who asked you
@@crabyinnocent2573Tf do u care💀🤣
HOP ALONG LIL DUDE🐰🐰
This is absolutely the best explanation of Histograms that you will find anywhere! Thank you for this video!
thank you sir for the brief explanation was having a hard time doing homework but I am now loving it thanks so much!!!
Operation “Save The Semester” was possible because of you 🙏🏿🙏🏿🙏🏿🙏🏿🙏🏿
We really appreciate your feedback.
Best of luck.
Thank you so much papa God bless you greatly
Thank you too
Thanks so much.I have understood better. Sitting my exams in two days
You are welcome. All the best.
Why did you use class boundary for the first frequency polygon and used CMV to find the second frequency polygon question😢
Thank you so much. Helped me a whole lot
Thanks may God bless you this is really helpful
Thank you so much! The explanation was really very clear, which helped me a lot.
Wonderful video 👏👏
You're very welcome! We are glad you found the video helpful.
Thanks a lot
Good teaching
Great effort
It's my pleasure
Excuse sir how do you calculate the mean and median using a histogram and frequency polygon?
Thanks teacher for you explanation
You are welcome.
Using 13 as origin,is it the best or I should use the zigzag sign when plotting
Use the zigzag please.
Why 8 before 0 sir ...there are no negatives ...but 8 lies on negative side
How did make the graph?
hello sir how may i ask how did i determine the skewness of the data
To determine the skewness of a set of data we use the formula below:
Skew = 3 * (Mean - Median) / Standard Deviation.
Hello when I sketch the polygon should I rub the histogram and show only the polygon
It's not necessary. Leave it like that.
What If I draw my histogram without class boundaries ?
If only you can build a house without foundation.
clearly explained,thanks so much
Great work thanks sir really you helped me today 🥰
You are welcome. We really appreciate your feedback and compliment.
Warm regards.
Is it continuous or discrete ?
Hi from guyana ms 😊😊😊😅😊😊
How can I contact you
Follow the link below to chat us on WhatsApp:
wa.me/message/EGA2ZOTSBW3DE1
Much thanks
Is mode and mid value is same ?
No
Can you just explain mode and mid value
Mode is connected to the entire distribution while the mid-value is connected to the class interval of the distribution (grouped data).
The data that appears most or with highest number of occurrences (data with largest frequency) is the mode of the distribution.
The mid-value of a class interval is the particular data that falls in the middle of the interval. The mid-value is calculated by adding the upper limit and the lower limit and then divide the sum by two.
Thankyou 💥
Just a question what's the difference between a histogram and polygon
This is so clearly explained. Thanks
very educative thumb up.
i love the way he explains😄
Thank you so much for your compliment.
We really appreciate your feedback.
🤝🤝🤝
Where is the scale
Do you join the lines hand freely or with a ruler
Thank you for your interest in our videos.
On your question, you join with a ruler.
Warm regards.
Good teaching....
Well done sir!
Thank you it is well explained I have understood
You are welcome.
Glad it helped.
I love it.Thankyou sir
You are welcome.
We are glad you enjoyed the video. Warm regards.
Thanks doctor
You're welcome.
Warmest regards.
thank you
You're welcome
The tutorial is great 👍
Thank you! Cheers!
We really appreciate your feedback and compliment.
Warm regards.
Awesome
Semester saved😂
Hello po sir, may i ask how did you get the numbers in frequency column?
They are part of the data provided in the question.
They are provided always
Thanks a lot
Good teaching
Great effort
Very helpful toe to resolve the children questions on statistics
Thanks
You are welcome.
We really appreciate your feedback and compliment.
Warm regards.
Help me on how to calculate the number of students who got less than 28 marks
You can only do that with cumulative frequency curve
This explanation is very simple and clear.
Sir can I ask question ❓ that sir in class boundary there is no krink mark because starting is 0.5 - 10.5 so there will be krink mark
It's optional to indicate the zig-zag or krink mark when the graph does not start from the origin.
pls i hv a question from histogram and it is:What if the highest frequency is the last value to be plotted on the graph when you cross the line of the vertex with the previous one plotted before it,since there is no other one to be plotted after it how would you be able to use only one vertex to find the point/line of intersection or would it not be possible?This is my question and i also await your response..
Sir, which apps you are using for drawing this histogram
We use Ms PowerPoint, draw and animate.
The mothers teacher is correct. Good Job
Thanks for your compliment
Thanks alot
What if you are given a large number e.g150-154.….
I could visualize these things deeply
Thank u sir
May I know where u r from?
Visit www.oninabresources.com
@@OninabResources ok
Congratulations sir
Thanks so much for your feedback.
Warm regards.
Im watching this right before my exams this afternoon 😮about 4 hours to my paper. And you've explained it so well. Thank youuu so much dear life saver.
Best of luck! You are welcome.
Thanks 😊👍 today
You are welcome😊
Thanks sir....Great lesson
Am really great thanks 👍 keep it up
This was really helpful thanks alot❤🎉
Thanks 👍
You are welcome.
Warmest regards.
Thank you so much am sure on Monday I will write well my exam may God uplift you lecturer
You're welcome. Amen to your prayer. Best of luck in your exam.
Thanks you so much you help me alot❤
Thanks much🙏
You are welcome.
We really appreciate your feedback.
Warm regards.
THANK YOU VERY MUCH. GOD BLESS YOU
👩🎓👩🎓👏👏
We appreciate your feedback.
It helped alot
Great respect
Thanks sir I can now understand histogram
Great!
You are welcome. We really appreciate your feedback.
Warm regards.
It was great
Thank you so much this was very helpful
It was too good ❤
Thanks for your feedback and compliment.
Warm regards.
Is it a must to start the labeling of the axis using 0.5
It depends on the nature of the distribution. So, where you start from depends the range of values of the distribution.
Thanks this is good
Frequency density?
Thank you so much!
Why did you use class boundary for the first question and class mid point for the second question Sir?
We use the class boundaries to draw the histogram while the mid points are used to draw the frequency polygon.
but clas boundary and class mid point is the same , my be
@@Yolla05 No it is not
I think we use the class boundaries to draw the polygon when it's together with the histogram but when it's to be drawn alone, we use the cumulative mid values
@@nakiryamaria1088 actually we use class boundary to draw histogram when the class intervals are non-continuos data because to draw histogram we need continuous class intervals. And we calculate mid value to draw frequency polygon without the help of histogram.
Thanks
Thank you sir 🙏❤
You are welcome.
We really appreciate your feedback.
Warm regards.
awesome
Best video on the internet
Cool
Nice
What about a histogram scale without a scale graph possible to make please tell me about the scale
33-36 which is midpoint sir🙏🏿
Mid-value = (33+36)÷2 = 34.5
Thanks Sir
With this explanation, it's so easy.
thanks a lottt
Thanks a lot sir
You are most welcome.
Please sir can you make a video on statistics when given to find the value of x and y
And to find missing frequency 🙏
Very helpful ❤
Great 💯👍
But does the bar start at point 0 (zero ) as you start drawing the graph, or from the point of scale. 0.5?
From 0.5 which is the lower class boundary of the first class interval.
The graph does not start from the origin.
@@OninabResources but you have indicated 0.5 at point zero and the intersection of x and y axis is usually point zero
That is x-y plane and this is not basically x-y plane
The frequency axis is labelled 0.5 which means the intersection of f and can axes is not the origin. Okay what will you do if the first Class interval is 41 - 50?
yes
@@ruvimbonzarayebani2266 ok
Excellent my lecturer!
Like man God seriously bless and uplift you
Assignment was given improptu and I am in a rush, you're the only TH-camr who went direct and very explainable too
God really be with you
Thanks so much
I'm henceforth a new subbie and I'll always make sure the ads play so u get paid.
Well done fr