IELTS Line Graph - рҹ“Ҳрҹ“үWriting Task 1 - Sample Answer from a TEACHER

аёқаёұаёҮ
- а№Җаёңаёўа№ҒаёһаёЈа№Ҳа№ҖаёЎаё·а№Ҳаёӯ 21 аёҒ.аёў. 2024
- рқ—ңМІрқ—ҳМІрқ—ҹМІрқ—§МІрқ—ҰМІ МІрқ——МІрқ—”МІрқ—ңМІрқ—ҹМІрқ—¬МІ МІрқ—”МІрқ—ЈМІрқ—ЈМІ МІрқ——МІрқ—ўМІрқ—ӘМІрқ—ЎМІрқ—ҹМІрқ—ўМІрқ—”МІрқ——МІ
ielts-daily.com
IELTS Daily is a private company which is unrelated in any way to any of the parent companies of IELTS. We are not endorsed by IELTS.


Do you want free IELTS videos and *model answers* (writing)? рҹҳҠрҹ‘Ҹ
Come and download them here at ielts-daily.com/welcome
How can I receive your modal answers through my email? I wrote my email and could not receive any modal answers. Can you help me? Many thanks
With your strategies, I got a beautiful 8 from listening part in my previous Mock. Now I'm focusing on writing and I'm gonna Rock. You're wonderful. Thank you a world рҹ’ҡ
Wonderful рҹҳҢ well done вң…вң…
Which videos did you see for listening?
Chris, please help me check my answer. You are the best tutor in ielts.
The line graph illustrates the popularity of enrolments in three subjects at a regional university from the period of 1960 to 2020.
Overall, the degree of medicine was popular over the period, while the preference of science remained fairly the same.
In clear contrast, humanities was the least favourable choice.
Medicine was the least preferred subject at the beginning with only 20% in 1960. It earned a steady increment to
35% by 2000 which became the most preferred one at that time. It suffered a 5% decline in popularity since then and became stable
till 2020.
The preference in science subject experienced a slight decline at first, from 30% in 1960 to 26% in 1980. It became stable
in the following 10 years. Since then, it made a steady increase to a total of 30% by 2020, which was the same level as medicine.
Humanities suffered an apparent drop in enrolments. It was the most favourable subjects with 45% in 1960 and still experienced
a slow rise over 10 years. However, the drop in numbers was apparent since 1970. The sharp fall resulted it to a third place of 8% in 2020.
Hi. If you want to get writing feedback you can become a member.
@@IELTSDaily
Chris, can you just score my writing? No need comment or feedback, thank you so much
I have taken the IELTS mock test and got 6.0. I reached 6.5 for my writing task 1 because of your "golden tips and wonderful vocabulary" you gave. I'm thankful about youрҹӨ—
Incredible! Thank you for sharing :)
@@IELTSDaily I'm a big fan of you and your pronunciation
@@IELTSDaily Could you please explain what is the hardest part of the exam??!!
@@IELTSDaily Is your accent "British??! Or American??!рҹӨ”рҹӨ” Because when you pronounce "t" sound, it seems me "british". However, it sounds like an american accent when you say " gonna"
@@dreamer2352 That's an australian accent. Gonna is short form of going to, It is not only used by americans but speakers all over the world.
I never seen before...tutor like you...you are doing really nice work....I am learning lot of things ...and applying also...I will give my ielts exam within 2 months....thanku for this great service..
Thanks Deep for your kind words рҹҳҢрҹҳҢ
I have recently discovered your videos and find them extremely helpful.
The line graph illustrates how the percentage of students enrolled to study medicine, humanities and science has varied from 1960 to 2020 at a regional university.
The most significant fact that stands out is the dramatic decrease in the popularity of social studies, while scientific careers have remained almost equal and there has been a slight increment in the health path choice. Humanities used to be student's primary choice of education, however, nowadays, they prefer other options.
The interest in humanities' studies has gradually been declining since the 1970s. Where in the beginning almost 45% students decided on this field of study it has now dropped to less than 10%.
Medicine, on the other hand, has increased 10% from it's numbers in 1960. Reaching in 2000 it's peak, with over 30% of the university's enrolments.
Science remained somewhat stable during the course of the last 6 decades. Diminishing less than 5%, only to recover back again in the recent years.
6.0
@@IELTSDaily Thank you for your response!!
At the beginning of your introduction you forget to write many after how.
вҖӢ@@IELTSDailyI will write my writing, will you mark my essay please
Thank you ielts daily for your help. I got overall 7 with each band 7 and 8 except for writing(6.5) and now i have to practice writing for band 7. I hope your videos and guidance will help me get my desired score againрҹҳҠрҹӨ—
Loved it, so far the easy way to write & explain line graphs
nice
The line graph illustrates the information regarding the intake of distinct kind of meat in between 1979 and 2004, in a European country.
Overall, it can be vivid that the consumption of beef and lamb revealed downward trend, whereas consumption of chicken indicated an upward trend, throughout the given period of time.
To begin with, the consumption of beef was nearly 210 gram per person a week in 1997 and 240 gram was in 1985. The figure of per week intake of beef stood at 180 grams in 1979 and then reached at roughly 100 grams in 2004. In 1979, the utilisation of meat by per person was 55 grams which further remained stable in all given years.
Moving further, the consumption of chicken am lamb was at similar point, 150 grams in 1976, while in 1994, the utilisation of meat by person rose gradually and reached approximately at 240 grames, meanwhile, intake of lamb declined moderately and the figure was 70 grams. In 2004, the consumption of chicken was 250 grams which indicated it's worth stating feature.
Best on TH-cam, your videos boost my confidence a lot . Thanks a lot my exam is in a week time .
Wonderful
This is my answer for the writing task, a feedback would be very appreciated! many thanks:)
The line graph compares the number of households in one US city that uses different types of technology to watch television namely satellite, cable, internet, and broadcast from 2004 to 2014.
Overall, the use of satellite and cable increased while broadcast kept decreasing throughout the years. On the other hand, cable usage fluctuated mildly and decreased by the end of the period.
In 2004, around 70,000 households uses satellites as their choice of techology to watch television. This number did not change much throughout the years, showing mild growth in the graph until finally reaching almost 120,000 in 2014. On the other hand, internet usage increased drastically, even having roughly 190,000 users at the end of the period. Although internet had the lowest user count in 2004, the numbers quickly grew and it became the most popular choice above all.
The users of cables experienced slight fluctuation in the middle of the period until finally decreasing in 2014. Surprisingly, while broadcast users had the highest number in 2004, they fell and only had around 20,000 users in 2014.
Keep it up. Your writing skills are perfect!!!
Hello i watch ur videos from Uzbekistan . You are the best online teacher i've ever seen . And i can kearn lots of information from ur videos . Your videos always helps me to improve my English skiils . Thank you for yr videos and keep going рҹҷҢрҹҸ»
What an amazing comment рҹ’ҷрҹ’ҡ
Hello Chris рҹ‘ӢрҹҸ» This is my homework. Please review my answer. IвҖҷm really thankful for your kindness in making these useful videos to help me all along .
вҖңThe line graph illustrates the data on the percentage of student enrolment in several courses over 60 years, starting from 1960 to 2020.
During the time, the popularity of three different subjects altered differently. Medicine enrolment slightly increased whereas the enrolment of Humanities considerably decreased. Science, on the other hand, stayed the same throughout a 60-year period.
As for Medicine, the popularity continually increased from 20% to 35% over 40 years between 1960 and 2000. Afterward, the enrolment slightly dropped to 30% in 2020.
In contrast to Medicine, Humanities experienced a significant decline over the period. In the first decade, the enrolments were higher than Medicine. Then, it started to drop from 45% in 1970 to about 7% in 2020. Regarding as the least popular subject.
Sciencepopularity was comparatively steady during the time. The enrolments had been dropped slightly from 30% in 1960 to around 27% in 1980 and stayed the same until 2000. After this point, it gradually returned to the previous level which is equal to Medicine popularity level.вҖқ
Line graph i needed it most thanks for this precious lesson line graph is little tricky for me
You're welcome Prawasha. Glad you found this helpful.
I wrote a sample too:
The line graph presents data on the percentage of students majoring in three different subjects at a regional university over six decades (1960-2020).
Overall, while enrolment figures for science had gone up by the end of the period, the reverse is true for humanities. When it comes to science, there were not marked changes over the years.
At the beginning, the proportion of those studying medicine was the lowest, at 20%. By 2000, however, this figure had grown to a high of 34%, becoming the most selected subject. Although there was a decline to below 30% in 2000, a period of relative stability followed until 2020.
Science was the second most preferred subject in 1960, being elected by 30% of the universityвҖҷs students. This proportion gradually fell to 26% in 1980 and stayed stable over the following two decades before rising back to 30% in 2020.
In 1960 humanities had the highest percentage of students (45%). This subject retained its popularity until 1970, when it reached a peak of 46%. Surprisingly, the percentage of students enrolling in humanities then started to rapidly decrease, eventually plummeting to a trough of 6% at in 2020. (193 words).
Eynar r you preparing for academic IELTS
Chris, can you just help me score my writing, no need comment or feedback. Thank you so much.
The line graph illustrates the popularity of enrolments in three subjects at a regional university from the period of 1960 to 2020.
Overall, the degree of medicine was popular over the period, while the preference of science remained fairly the same.
In clear contrast, humanities was the least favourable choice.
Medicine was the least preferred subject at the beginning with only 20% in 1960. It earned a steady increment to
35% by 2000 which became the most preferred one at that time. It suffered a 5% decline in popularity since then and became stable
till 2020.
The preference in science subject experienced a slight decline at first, from 30% in 1960 to 26% in 1980. It became stable
in the following 10 years. Since then, it made a steady increase to a total of 30% by 2020, which was the same level as medicine.
Humanities suffered a apparent drop in enrolments. It was the most favourable subjects with 45% in 1960 and still experienced
a slow rise over 10 years. However, the drop in numbers was apparent since 1970. The sharp fall resulted in a third place of 8% in 2020.
Just start to prepare IELTS for academic . Not fix test date yet . Really far away to back to study again -_-;;. This kind of teaching method is really helpful . Thank you !
Welcome Ruth
This video is really helpful. Thank you.
The graph shows the percentage of the popularity of three enrolments at a regional university from 1960 to 2020.
Overall, medicine was the least popular subject in 1960, however, it became more popular for the next 60 years. On the other hand, humanities had the biggest proportion of enrolments at first but decreased significantly during the 60-year period. The popularity of science was relatively stable between 1960 and 2020.
Originally, there were only 20% of students enrolled in medicine. The proportion increased significantly and reached a peak at 35% in 2000. After that, the percentage of enrolments decreased slightly to 30% in 2020 and was as popular as medicine.
Humanities was the most popular subject which accounted for 45% of student enrolments in 1960. The proportion started to decrease from 1970, and it dropped dramatically to around 7% within 50 years.
Unlike the other subjects, science remained relatively stable from 1960 to 2020. Still, the enrolments decreased slightly to around 25% between 1980 and 2000 but it returned to 30% in 2020.
~7.0
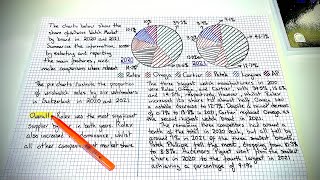
The line graph illustrates the proportion of students who undertook Medicine, Humanities and Science at a regional University from 1960 to 2020.
Overall, the percentage of students that enrolled for Medicine increased over the time period while the popularity of Humanities experienced a downward trend. The proportion of student enrollment in Science remained relatively stable.
In 1960, Medicine was the least popular subject starting at 20%. It became well known over the years in the university and peaked at about 35% in 2000. From then on, it decreased slightly to 30% becoming one of the popular subjects among students in 2020.
The proportion of students that enrolled in Science started at 30% and decreased slightly to about 25% in 1980 where it remained unchanged till 2000. Thereafter, it equaled in popularity as Medicine among students in 2020 (30%).
Humanities started in 1960 as the most most popular subject with a proportion of approximately 45% of student enrollment. But this declined significantly over the years to around 7% in 2020, where it became the least undertaken subject among students .
Hi Chris, please check my work. Thank you
7.5
Wow thank you Chris
Can you please tell me some of the mistakes I made or some informations I left out?
I don't give detailed feedback for free sorry. If you want personalised feedback you can get it here: IELTS-daily.com/writingfeedback
Can you evaluate this please ? I tried writing before the video started.
The line graph illustrates the statistics concerning the percentage of students studying three different subjects( medicine, humanities and science) at a regional university from the year 1960 to 2020.
Overall, the subject related to humanities experienced the most significant change, whereas there was only slight difference for science. There was more of an upward trend in popularity for medicine.
The humanities began the period with the highest percentage of students, exactly 45% in 1960, followed by a slight rise reaching its peak of over 40% until 1970. After this, it declined drastically throughout the whole time frame, reaching its lowest point of approximately 8% in 2020.
On the other hand, there was 30% of students enrolled science course in 1960 and it then drop moderately to about 26% in 1980. This figure remained constant until 2020, rising again at 30% in 2020.
Medicine started with 20% being the least popular among three subjects. However, it considerably ascend reaching the maximum at approximately 35% in 2000. It then slightly plummeted afterwards, having the similar popularity with science.
Hi, if you'd like feedback, you can join our channel paid membership and you get two pieces of feedback every month as a SuperStar th-cam.com/channels/39W_uzNjIAIYrimiKkI-rA.htmljoin
Only the best tutor I have ever seen.
That's very kind, thanks for the nice comment.
Me too
The given line graph enumerates how popular were three different subjects, (medicine, humanities, and science) at regional university from 1960 to 2020.
Overall, the figure for the percentage of studentвҖҷs enrollment in medicine showed a spurt in trajectory, whereas the figure for popularity of humanities represented a steady downward trend and the science remained plateaued throughout the period.
In the beginning of the period, although studentsвҖҷ interest towards humanities was highest of all three subjects, with the passage of time it witnessed a drop from around 45% to about 5% by the end of the year 2020. In stark contrast, the percentage of learnerвҖҷs enrolment in medicine stood at precisely 20% and thereafter it rose moderately to a peak of approximately 34 per cent before falling to just below 30 percent, nevertheless it then levelled off by the end of span.
On the other hand, it is clearly visible that the studentвҖҷs fascination for science remained relatively steady between 1980 and 2000. Moreover, it reached the same value and therefore there is no change.
The table gives information about the international visitors to Canada from four different countries: The United States, India, Nigeria, and The Philippines; in the years: 1950, 1980, and 2015.
Overall, the tourists from all four countries were on rise, but the highest number of visitors were from the United States whereas the lowest from Nigeria. India and the Philippines witnessed drastic increase in tourists.
The United States witnessed an increase with a peak of 11,500,000 in the year 2015 which started at around 4,300,000 in 1950. Visitors from Nigeria in 1950 was 20,000 and reached 250,000 in the year 2015 which demonstrated a stable trend and became the least number of visitors compared to others.
India and the Philippines illustrated a medium-paced upward trend. Initially, India was at the lowest influx of tourists around 5,000 which increased dramatically to peak at 550,000. In case of the Philippines, it ranked second in all the three years, reaching up to 600,000 tourists, doubling every year.
Please correct me. Word count: 163
Hello, sir. This is my writing, I would appreciate it if you could take a look and assess it. Thank You.
The line graph gives us the information on the percentage of student enrolments in 3 different subjects, which are medicine, science, and humanities at a regional university from 1960 to 2020.
In general, the popularity of humanities decreased significantly. On the other hand, medicine has gained popularity over the 6 decades. Science, however, remained stable over this particular period.
Humanities lost itвҖҷs popularity over time, starting at 45% in 1960 and ended at less than 10% in 2020. This downward trend caused humanities to be the least popular course in that particular regional university.
Contrary to humanities, medicine gained popularity during the period. It started at 20% in 1960 and has the highest of 35% in 2000, ended at 30% in 2020.
Science did not experience that much of a difference. It remained stable. It started at 30% in 1960, had a slight decrease in 1980, but gained itвҖҷs popularity back in 2000, and finished at 30% in 2020.
6.5
good illustration!
Thanks
Hi Chris, please give a score on my sample answer below :
The line graph provides data on the proportion of student admissions in Medicine,Humanities and Science at a regional university from 1960 to 2020.
Overall, the popularity of medicine increased during this period while humanities experienced a significant decrease in the percentage of enrollments whereas science remained relatively stable throughout the period.
Medicine demonstrated a rapid growth in popularity, starting at 20% in 1960 and eventually reached a peak of 35% in 2000 after which it fell slightly, culminating to 30% in 2020.
Humanities, as opposed to medicine, witnessed a different trend. The enrollments started at 45% in 1960 and devalued significantly over the period, falling to around 7% in 2020, becoming the least popular course type.
With regard to science which remained relatively constant, starting at 30% in 1960 whose admissions decreased slightly over the following 40 years, then returned to the same level in 2020.
Hi Chris, appreciate your feedback on the below write up ;
The graph provides data on the percentage of student enrollments in three subjects at a regional university between the years of 1960 to 2020
Overall the statistics shows an increase in the students choice in enrolling to study medicine, whilst the interest to study humanity shows a significant decrease among the students enrolled at the regional university. However science statistics remains within a similar percentage through out the years of the study as a subject that has been considered amongst the students during the period of the 1960s and well into the millennium.
When it comes to the popularity of the subject of medicine there is a considerable growth from 20% in the 1960s to reaching its highest of 35% in the year 2000.However it decreases slightly by 5% in year 2020.
Humanity on the other hand saw a different trend compared to medicine. even though in the 1960s humanity was a popular subject there was a significant decrease starting in the 1970s and there after falling to merely a 5% by the year 2020.
Science remained at 30% in the 1960s and in the year 2020. There was a slight fall of 5% between the period between the years of 1980 to year 2000. Science however was equally a popular subject as medicine among the students at the regional university
sexy answer, make sure you improve it to get band 9
hello sir thank you very much for the video
This graph shows the percentage of student enrolment for three selective courses in a regional university between 1960 to 2020.
Student enrolment for medicine starts from 20% in 1960s and it reach its climax by 2000. However it indicates a slight decrease by 2020.
Humanity has marked its highest point in 1960 and it starts to decrease gradually since then and became least popular subject in 2020 by marking a low value of 8%.
Science had a popularity of 30% in 1960 and it only face a slight change during the 60 years. However in 2020 science became equally popular as medicine.
Basically during the time medicine is the only subject that shows a growth in student enrolment while science remain unchanged. In contrast humanity depicts a gradual decrease in student enrolment over the period.
its clear and well undestanbale how you teach
thank you so much please keep it up .....
You're most welcome and we will.
The line graph provides comperation on proportion of the student enrolments in three different majors at a regional university from 1960 to 2020.
medicine seems to be more and more popular. Student enrolments in medicine increase from 20% at 1960 to approximately 34% at 2000, then fell back to 30% at 2020.
humanities kept its highest enrolments (nearly 45%) from 1960 to 1970, but from then on, it was significently continuously decreasing to 7% at 2020.
science has a relatively stable performance than the two others. Student enrolments rate of science decreased from 30% at 1960 to 27% at 2000, and then return to 30% at 2020.
As a consequence, medicine and humanities both have an apparent change during the latest 6 decades that the former has an slightly increasing trend and the latter has a sharp decreasing trend, while the performance of student enrolments rate in science is relatively smooth.
Score 5.5
@@IELTSDaily Thank you!
The line graph illustrates the student enrolments percentage in medicine, humanities and science at an university from 1960 to 2020.
Generally, it is noticeable that the number of students enrolled in humanities demonstrated a decreasing trend over the half decade. Also, it is patently obvious that there was small fluctuation in medicine and science subject enrolment over the period of 60 years.
As is presented in the line graph, humanities was the most popular subjects among the students. Students who chose humanities slightly rose after 1960 and reached a peak with around 46% in 1970. However, from the point onwards, the figure witnessed a downward trend. The percentage dropped drastically to below 10% in 2020.
By contrast, the number of students enrolled in medicine and science didnвҖҷt show a great change overall. Medicine subjectвҖҷs enrolment grew up from 20% initially and got to climax with approximately 35% in 2000. After that, it dropped considerably to exactly 30% in 2020. Science subjectвҖҷs enrolment stayed about the same throughout the years, which accounted to around 20% to 30% in overall.
could you plz help me assess this? thx so much
I did this before watching your video because I wanted to try on my own
6.0
The graph illustrates data on the percentage of pupils who enrolled for three differing courses at a regional university over a 60 year period starting from the year1960. Overall, humanities decreased substantially while medicine experienced a slight rise. Science remained relatively stable over the period.
Medicine started at 20 percent in 1960, then it increased steadily and eventually reached a high of 35 percent in 2000, after this point it fell slightly by 5 percent and ended at 30 percent in 2020.
Science began at 30 percent, afterwards dropping minutely to 25 percent and remained so for 20 year until it finally increased by approximately 5 percent, then finishing at 30 percent in 2020.
Humanities went through an extremely different trend. Enrollments started off high at 45 percent, shortly after peaking at 46 percent in 1965. After which it decreased immensely over to next 40 years, finishing at 7 percent in 2020.
P.S. I am going to take IELTS in a week, wish me luck! Also someone help me grade this (give me details on TA GRA LR CC).
Best wishes for your test. You could score 6.5-7.0 (possibly 7.5) with this answer. It depends how strict your examiner is. We'll give you 7.0.
Thank you! And I suppose it is that low since the word count is only 152.
@@з« з”ҹ-e9m No, the word count is fine. Other areas to improve. Also, 7.0 is a good score!
Thank you again! I suppose that problems were mostly in the third paragraph. I typed this essay on keyboard and I tend to make mistakes once I do both in spelling and grammar forms.
Also I consider this a low score because I am aiming for a writing (Academic) 7.5, speaking 8, listening 8, and reading 7.
The given graph illustrates the information on the popularity of three subjects: medicine, humanity and science at a regional university from 1960 to 2020. Imperceptible(inconspicuous) change happened in interest towards science. Significant interest increase in the field of medicine, dramatic decrease happened in popularity of humanities.
I just decided to write before I watch the video then i can try to understand my mistakes
The provided graph illustrates the proportions of student enrollments in three different subjects at a regional university in the years 1960 and 2020.
Overall,medicine took the largest popularity in this time period,whereas humanities became the smallest popularity in the percentages of enrollments.Science stayed unchanged in this course.
The popularity of medicine increased starting at 20 percent in 1960 and reached a peak of 35 percent in 2000.Hereinafter,it fell gradually and stopped at 30 percent in 2020.
Humanities experienced much different trend.The enrollments began at 45 percent in 1960 and dropped considerably over the period.The enrollments declined by around 7 percent in 2020, gaining the least popularity course type among the others.
Science stayed stable,starting at 30 percent in 1960.The enrollments went down slowly over the next 40years but returned to the same level in 2020 and became as popular as medicine.
This is by far the most helpful video I've come across for the writing task.
Please review my writing and help me improve.
The linear graph sheds light on how the popularity of the three study fields has changed among the enrolled students over the years (1960-2020).
Overall, humanities faced a severe downfall in popularity starting from 1970 whereas medicine started to gain popularity in the same time period. However, science has continued to be a popular choice among the pupils in the past 60 years.
Humanities was the top subject choice for 45% of the students in the year 1960 and stayed the same for 10 more. But after 1970, it started losing popularity gradually and finally reached the 7% mark in 2020.
Medicine proved to be a good choice of study for 20% of the students in the year 1960. It started gaining popularity amongst the pupils from 1970 and reached a maximum of 35% in the year 2000. However, it did face a fall and reached 30% in 2020 where it became as popular as science.
Science is by far the only subject with the least differences in popularity from 1960-2020. It has maintained its popularity at 30% since the very beginning. There was a slight decrease from 30% after 1980 where it reached 27% and remained the same for 20 years. After that, it started regaining attention and re-attained 30% by 2020.
Thanks for your kind words.
7.0
@@IELTSDaily thank you so much for the fast reply рҹҘәрҹ’“
Good evening.
The line graph illustrates the popularity of student enrolments on the medicine, science and humanities at a regional university from 1960 to 2020.
The popularity of medicine expanded over the period whereas humanities extremely declined. Science showed stability in this duration.
In popularity, the medicine started with 20% in 1960 and reached the top percentage of 35% in 2000. In 2020,it decreased lightly and ended with 30%.
In 1960,the science began with the proportion of 30% in the student enrolments and finished at this percentage after 60-year period. It was the same as medicine's development.
With being different from other subjects humanities was at the greatest level in the beginning and showed almost 45%. Then it experienced a significant downward trend with crossing the medicine and science between 1980 and 2000. It was somehow steady till 2020 and ended with the least percentage of enrolments.
Can you give me a score and feedback, plsрҹҘә
i really appreciate this video, my ietls teacher was going out of the topic and he taught me about this topic in a wrong way. thank you so much!
You're welcome
The bar graph shows the percentage figures on the significance of three majors at a domestic college from the start of 1960 to the late 2022.
Overall, Medicine reached to the highest popularity while Humanities plummeted in a large proposition. However, Science remained on a relative stability over the span.
Starting from 1960, the percentage of medicine slowly increased for 40 years until it reached to its peak in 2000s. Then, it slightly decrease and finished at 30% in 2020.
Science had a stable enrolment. It barely went down for the first 20 years, then plateau for the next 20 years before it reached to the same level again in 2020.
Humanities had a large decrease throughout the period. It started at 45% and moderately increased for 10 years. After that point, it significantly decreased and reached to its lowest point in 2022.
Hello
The line graph illustrates the data on the enrollment in Humanties, science and medcian subjects at areginonal universiry from 1960 to 2020.
Overall, there was an increase in the percentage of students enrollment in medicine subject over the period. In clear contrast Humanities subject experienced a noticeable decrease while science reamined relatively stable over a 60-year period.
Humanities subject experienced a decline in rate. It started by increasing considerably until 1970 before falling significantly to approximately 7% in 2020.
an increase in pupils enrollment was apparent in the category medicine subject. The proprtion of medicine subject enrollment increased slightly from exactly afifth in 1960 to around 35%, which was an apex in 2000. After this point, it declined slightly to precisely 30% in 2010.
.
Science figure remained relatively stable.Whereas the science' figure began at exactly 30%, and it had fallen to just under 30% by 2000,but then it return the same at the beginning at 30%.
could you assess this work.
thank you so much.
5.5
This is my answer for one of your writing tasks. Can you give a review?
The line graph provides data about the usage of different technology for watching television in households of a US city from the year 2004 to 2014.
A glance at the graph reveals that broadcast services was so popular in the beginning and it was least favored and replaced by internet over the period. The utilization of satellite has slightly increased over the years, while cable experienced a visible decline in the number of consumers. Although, there is a significant rise in the overall usage of internet facilities. And broadcast services faced a gradual dip in its subscription.
When we analyze the data of satellite, its usage started from around 80000 homes in 2004 and climbed up to around 120000 in 2014. Data of cable shows that, it was used by over 80000 households in 2004 and reached at a peak of 120000 in 2008. After this point, it decreased slightly and finished with below 80000 subscribers in 2014.
Internet usage boomed substantially from almost zero users in 2004 to around 200000 over the 10 years. A significant increase in the usage makes it tops the list by the end of 2014. Broadcast services covered almost 85000 households in 2004. While it experienced a downfall over the period. It ended up in the bottom of the list with almost no subscribers in 2014.
Hi Angel, for feedback you can join our SuperWriter membership
The given line chart summarizes the data of the percentage demand of three different courses at a regional university for a 60-year period beginning from the 1960s.
Overall, the demand for medicine courses has seen an increase, whereas the popularity of the humanities curriculum experienced a significant decrease in the percentage of enrollments. However, the need for science courses remained relatively stable over the given time frame.
The medicinal course has seen a surge in popularity, with just 20% student engagement in 1960 reaching a peak of about 35% in 2000. Finally, in the year 2020, the demand for the subject settled at 30%.
The subject of humanities experienced a sharp decline in student enrolment. In the year 1960, the percentage of student enrolment was about 45% which plummeted to about 7% in the year 2020, making it the least popular subject to choose.
Science enrolments almost remained at the same level of around 30% throughout. However, it decreased slightly between 1980 to 2000 but reached the previous levels in 2020 making its popularity the same as that of medicine.
The line graph illustrates student enrolments in medicine, science, and humanities percentagewise at a regional university from 1960 to 2020.
Overall, the percentage of student enrolment increased in medicine but decreased in humanities throughout the 60-year period. The popularity of science remained relatively stable during the same period.
Medicine had its population started at 20% in 1960, then it increased gradually to the peak of 35% in 2000 and fell a bit to 30% in 2020.
The percent of enrolment in humanities dropped dramatically from 45% in 1960 to less than 10% at the end of the period which means it turned from the most popular subject at the beginning to the least popular one at the end.
The percentage enrolment in science decreased slightly from 30% in 1960 to about 25% in the middle of the period before went back to 30% in 2020.
Thank you so much for the video! I found it extremely helpful due to the difficulties that I have been encountering. However, I realized that there were some repetitions of lexical choices in your writing, and my question is about the marking criteria concerning the repetition in the IELTS Writing Task 1. I really appreciate if you can help me clarify this aspect. Thank you!
The line graph furnishes information on the trends of three courses at the local university between 1960 and 2020.
Overall, it can be clearly seen that medicine enrollments popularity were significantly increased while the humanities enrollments dropped dramatically from 1960 to 2020. Another subject is that science remain slightly stable over the past decades. The proportion are measure in a percentage of pupils.
The popularity trend of medicine course was starting at a fifth in 1960 reached nearly a third in 2000. In 2020 medicine enrollments slightly decreased at 30 same as science enrollments.
The humanities enrollments is the most popular in 1960 reached at a half after which time the trends were drastically dropped and reached the lowest percentage at 8 when compared with medicine and science.
The enrollments of science course seem to be constant, starting at less than a third in 1960 after that trend was slightly went down at 25. In 2020, science popularity was remain 30 again.
Thank so much for checking my work. I am so glad for watching your video.
6.0-6.5
The line graph provides data on the proportion of student enrolments in three different courses at a regional university from 1960 to 2020. Overall, the popularity of medicine increased over the period of time however, humanities experienced a significant decline in the proportion of enrolment. Science remained relatively unchanged over the 60-year period.
Medicine increased in popularity starting at 20% in 1960 and swelled to a peak of 35% in 2000.After this point, it decreased slightly and finished at 30% in 2020.
Humanities witnessed a very different trend. The enrolments started at 45% in 1960 and decreased significantly over the period.The enrolments fell to around 7% in 2020, becoming the least popular course type.
Science remained relatively unchanged, starting at 30% in 1960. The enrolments decreased slightly over the next 40 years but returned at the same level in 2020 and was equally as popular as medicine.
The graph provides information on the popularity of three subject courses at a local university from 1960 to 2020.
Overall, by the end of the period, Humanity had lost its dominance in the percentage of student enrolments, while, Conversely, Medicine had gained popularity. The percentage of enrolments in Science was fairly stable throughout the timeline.
In 1960, Humanities was the most popular subject, with around 45% of the sum of enrolments. This ratio was constant until 1970. However, by 2020, Humanities had suffered a sharp decrease in popularity and reached 7% in total student enrolments.
In 1960, Science had around 30% of the total enrolments. It had lost some percent until 1990 but regained all by 2020. But it was relatively stable throughout the timeline.
In 1960, Medicine was the least popular course among students, with 20% of total enrolments. Its popularity saw a rise until 2000, having around 34% and reaching its maximum during the period. However, from 2000 to 2020, it lost some of its enrolments and reached 30%.
The subject with the most significant changes was Humanities, with around 40% reduction, and the subject with the most minor and negligible variation was Science. The only course that attracted more students, with respect to the beginning of the 60 years, was Medicine, with a 10% rise. Interestingly, in the year 1986, all three courses had around the same amount of students, equal to about 27%.
please rate this answer (9-1)
This illustrated line graph represents data on the popularity of medicine, humanities, and science subjects at a regional university from 1960 to 2020.
Overall, the popularity of medicine went up while humanities experienced a significant drop in the percentage of enrolments. Science remained relatively the same over the 60 years.
Medicine rose to its highest popularity in 2000 and slightly declined to 30% in 2020. By contrast, medicine experienced a 10% upward trend from 1960 to 2020.
Humanities showed a tiny increment from early 1960 to late 1960. But after early 1970 the popularity of the subject dramatically fell by about 30%. As a result of that, this subject was the least popular one in 2020.
Moreover, science occupied a slight reduction in its popularity from 1960 to 1990. After 1990 the popularity bounced back to its previous level in 2020. Science and medicine had the same popularity level of 30% in 2020, being the most popular courses among the three selected subjects.
Thank you, Chris for your videos.
Pleasure
The given line graph elucidates the percentage of students who enrolled in three ubiquitous subjects namely Medicine, Humanities, and Science at a local university over a course of 60 years starting from 1960
As can be seen from the graph, it is clearly evident that the percentages of enrolments in Science and Medicine witnessed an upward trend while Humanities saw an opposite trend over the time frame. Moreover, Science and Medicine equally captured the most attention among university students.
In 1960, the proportion of students signing up for Humanities registered the highest, at roughly 45% compared to 30% and 20% of student enrolments in Science and Medicine respectively. Over the next twenty-five years, Humanities and Science saw a significant decrease in the percentages of enrolments, reaching under 30% in 1985. By contrast, there was a steady increase in the proportion of students joining Medicine at the same time
For the rest of the period shown, the figures for pupils signing up for Science and Medicine went up to approximately 30% despite some fluctuations, while the proportion of student enrolments in Humanities plunged below 7%
The line graph shows data on the proportion of college students who are enrolled in three different courses at a regional university from 1960 to 2020.
Overall, it clearly states that the Medicine department enrollees rose up during the early period while the Science course remained steady during the 40-yearsвҖҷ time. Then, Humanities had a sudden decline in the enrollment of university students.
According to the graph, Medicine started at 20% in the 1960s but at the end of the period, it had a slight decreased finishing at less than a third.
Meanwhile, the Science course had enrollees with 30% and after that, there is a plateau in enrollees between 1980 and 2000. By 2020, it became the same percentage of student enrollment as the Medicine course.
On the other hand, Humanities had a rough trend regarding the student admissions. In 1960, it had registered 45% of student enrollments. However, there was significant drop on the percentage of enrollees in the last period with 7% which it was the least popular course to be attended.
177 words
The line graph below illustrates the popularity of three different subjects at a regional university from 1960 and 2020.
Overall, the popularity of medicine showed a good increase, while humanities sharply decreased. Science relatively didnвҖҷt changed over 60-year period.
The popularity of medicine increased during the period, which started at 20%. From 2000 the percentage of popularity started decreasing and after all, it finished with 30% of popularity in 2020.
In 1960 humanities was in the highest level (45%), depending on medicine and science. But, unfortunately, it decreased significantly over the period. In 2020 it finished with around 8%, which was the lowest level, between these three subjects.
The popularity of science was 30% at start. It began falling down over the 40-year period , between 1960 and 1980.From 1980 to 2000 science stuck in the same percentage (about 37%) , while it started slightly increasing and finished at the same level as it started. Also the popularity of science was equal to the popularity of medicine.
Hello, sir. Can you check my answer, please
The line graph illustrates enrolment rates in three different subjects at a local university over 6 decades, commencing from 1960. It is clear that overall science experienced a stable trend while humanities and medicine show downward and upward trends, respectively.
First of all, during the period of 1960 till 1980, the percentage of enrolled students in medicine and science courses started from 20% and 30% respectively and met at around the quarter. Meanwhile, enrolment in humanities has dropped drastically to 35% despite remaining stable until 1970.
Secondly, for the following 2 decades, the declining trend in humanities continued and reached 15%. In the meantime, Science leveled off at just over a quarter over the whole period whereas the number of students who took medicine course rose gradually and peaked at a third of 100%.
Ultimately, in the last 20 years, enrolment rate recovered to its previous level in science as well as medicine fell back to the same level. When it comes to humanities, the dropping tendency still went on and came to a verge of nonexistence.
Hi Chris
The line graph provides details on the proportion of pupils enrollments in three subjects Medcian, Humanities and science in one typical university over a 60_year period from 1960.
Overall,enrollment students in three subjects have experienced opposite trends throughout the period. The popularity of Humanities subjects witnessed declined, while enrolment students for medicane subjects have seen an increase. Science experienced no change over the period.
The rate of students enrolled medicine subject started relatively low, at 20%in 1960, but there had been an overall soar and reaching an apex at nearly 35%in 2000.After this point, however, there had been a dwindle in 2020, hitting 30%.
Popularity for enrollment students Humanities subject started as the highest, reaching 45%in 1960.This fuguer plummeted incredibly to almost just under 10% nearly in 2010, there had been aslight decline in the final years, to 7% and becoming the least popular subject among other subjects throughout the period. Before stabilizing rate of science popularity among students, at just under30%, there was aslight increase, with 30%.By the end period, this percentage surged negligibly, at30%.
Could you please check this work
5.5-6.0
@@IELTSDaily thanks a lot Chris
Thanks! I would probably correct the last part of your thesis statement because science is not a subject but it's popularity :)
The graph provides data about three main majors at a district university in the midst of 1960 and 2020.
Overall, students who have taken medicine as their major started to increase, however, at the end of the period the percentage experienced a modest decline and the number of students could be the same, followed by science students. Students who have studied medicine was the highest, nonetheless, it decreased throughout the period.
First of all, Humanities subject was the highest of students who studied in 1960. In the beginning, the number of students had slightly increased. Nevertheless, in the middle of 1960 had a considerable drawback until approximately 10% in 2020.
Secondly, Students learned medicine had a lack of percentage compared with other subjects, although, it had the ability to improve significantly until 2020. After that point, the percentage of medicine students declined moderately and resumed to go up slightly. Furthermore, science students experienced a decline of about 10% and had a stable percentage throughout 20 years, the increase had been experienced by science course for 20 years in the last decades.
Hai Chris, would you check this writing? thankyou so much
I love your channel because it's so helpful :)
6.0
Thanks for your nice comment
Thank you so much for your video, could you give me feedback, please.
The line graph showcases the percentage of enrolments on three different courses at a regional university throughout a 60-year period starting from 1960.
The proportion of enrolments on medicine course witnessed a slight rise while this figure of humanities saw a pronounced decrease over the given period. The popularity of science remained unchanged between 1960 and 2020.
Commencing at 20% in 1960, the percentage of medicine course enrolments increase marginally to reach a peak of 35% in 2000. The enrolments afterward decreased slightly by 5% at the end of the period.
The population of humanities course took the lead at the start of the period given at over 45% then plummeted to about 7% in 2020.
Science remained relatively stable between 1960 and 2020. The enrolments started at 30% in 1960. After experiencing a fluctuation, the enrolments finished at the same amount as the start of the period.
@Sam Thanks for watching! We don't offer free feedback but we have a Superstar package which you're very much welcome to join.
Please, I would love to be a superstar member. How do I go about it? @@IELTSDaily
Hello,
The line graph illustrate the information on the proportion of students register in three different types of courses at regional university from 1960 to 2020.
Overall, it is clear from the graph, at the beginning of the time period more number of students were enrolle in humanities and less number of students were register in medicine.in contrast , at end of the period, less number of students took humanities and more number of students enrolled in medicine. However, tha another catagory like science subject were remain relatively constant at beginning and end of the period with minimum changes in its percentage in middle of the given time period.
Explicitly, in 1960 medicine were least of students enroll with 20% and it slightly reached to peak in the year of 2000 with around 35% and ofter this point the percentage was slightly decreased to approximately 30%.
Other category like humanities coarse , it was the heighist percentage with around 46% and then it continuously declined to approximately 8%.
Science was remined relatively stable over 60 year time period.in 1960 the graph showed its percentage was 30 % and it slightly decreased up to 2000 and it reached to same numeric like medicine.
Could you please assess my work
5.0-5.5
Thanque so much
Answer;
This line graph conveys an idea about the preference of three subjects, namely medicine, humanities and science, at a regional university ranging from 1960 to 2020.
At a glance, it is evident that the percentage of student enrolments in medicine shows the steepest overall increase whereas, humanities witnesses a drastic fall over the span of 60 years. Meanwhile, the number of percentage enrolments in science remains more or less the same.
On a deeper insight, the number of student enrolments in medicine shoots up rapidly from 20%, in 1960, to nearly 34% in 2000 following which it experiences a slight fall to 30% and then almost reaches a plateau.
On the other hand, the percentage of student enrolments in humanities shows a negligible rise prior to experiencing a conspicuous decline from about 1970 onwards to 2020 by nearly a 40% difference.
The number of students enrolling in science hardly displays any significant fluctuations although, it is useful to note that it shows a decrease from 30% to nearly 25% over the initial 20 years, after which it remains stable till 2000 and then redeems itself to its original value in 2020.
To sum up, from the given data, we can derive the fact that in the upcoming years medicine and science will most probably be the favourites of many attending the regional university in comparison with humanities.
Hello Sir, could you please assess my answer and provide a score? Thanks in advance!
The provided is a line graph representing data about the popularity of three subjects in certain local university , in the years 1960 and 2000. Units are measured in percentage measurements.
Overall, over the whole period, Medicine and science possessed the highest position in terms of popularity among the students, meanwhile, engagement for Humanities experienced a downward trend and possessed the lowest position during the period.
In 1960, the index for Humanities was its highest point (46%) and remained stable over the next ten years. But , there was a significant decrease in the popularity of Humanities from 45% in 1970 to 7% in 2000.
Regarding to science , started at 30% in 1960 and decreased to 25% , in the middle of the period the figure leveled off and returned as it is was in the begining.
The engagement for Medicine among students was 20% in 1960, there was a dramatic growth to 35%. However, in 2000 the index for Medicine decreased slightly to 30% and remained stable at the end of the period.
The above line graph depicts the student enrolment in three separate courses namely Medicine ,Humanities and sciences over a period ranging from 1960 to 2020.
overall student enrolment in the three subjects assumed different trends over the 60 year period.
whereas humanities was the most popular course in 1960 ,as shown it reached a peak of 45% its assumed a gradual decrease from 1970 and continued to attract less enrolment until 2020 when only 5% of the student population chose such related subjects.
students that chose medicine were just about 20% in 1960, however there was a dramatic increase in popularity of this course until the year 2000 when it reached a steady proportion before culminating to 30% by the year 2020.
Enrolment in science ,took almost a similar trend over the entire 60 year period begging at 30% in 1960 ,before slightly dropping to 25% in 1980 and remained constant until 2000 before attracting the initial percentage of applicants at 30% by the year 2020. total 173 words
great work it was usefull in many ways...thanks indeed chris
Very welcome - glad you enjoyed it
the line graph shows the popularity of three different subjects at a regional university between 1960 and 2020
at intial there is humanities which was at its peak from 1960 to around 1970 but then it experianced a dramatic fall and reached at it's lowest level of popularity in 2020
secondly sience experianced a slight down fall but then it leveled of and reaches it's same point as it was at the first
lastly medicine starting at 20 percent in 1960 then increased to a small extent. finaly reached at it's same level as sience
over all at first humanities hold a great appeal for students the medicine and sience was not that popular as much as humanities but after few years the humanitie's popularity droped dramaticly while the sience and medicine was as same as each other
4.5
The line chart illustrates, percentagewise, the number of enrolments in three different subjects at a regional university from the year 1960 to the year 2020.
Overall, the number of students who decided to study Science in 1960 and 2020 was the same. For what concerns Medicine and Humanities instead, the number of enrolments to those faculties rose slightly and fell dramatically, respectively.
The faculty of Medicine rose in popularity throughout the period. In 1960, just 20% of the students were interested in this line of study. This percentage rose steadily until it reached a peak of about 35% in the year 2000. After some fluctuations, the number assested at 30% in 2020.
On the other hand, Humanities witnessed a strong loss in popularity, falling quite steadily but significantly from around 46% in the 70s to less than 10% in 2010. This fall slowed down from 2010 to 2020, hitting its lowest point of around 6% in 2020.
The only subject that didnвҖҷt change much in enrolments was Science. After losing a bit of popularity (about 5%), the number of enrolments had a temporary leveling out. The percentage started rising again from the year 2000, returning to its original value.
Hi Alberto, you can have feedback on the official homework posts only.
The line graph provides the data on the proportion of candidates who enrolled into the three different courses at a regional university between 1960 and 2020.
The overall trends of the graph show the popularity gain for medical subjects while the humanities subjects have experienced a significant dipped in the percentage of enrolment. On the other hand, science subjectвҖҷs trend remains fairly stable between the indicated timeframe/60 years period.
The medical subjects have shown a steady level of increment from 20% up to the peak at approximately 35% throughout the first 40-year period following with a slight decline in popularity and stands at 30% as of 2020.
Next, the humanities subjects started off with a slight increment. However, in the following years, the popularity dropped significantly from approximately 45% in 1960 to below 10% in 2020 becoming the least popular subject between the other courses.
On the other hand, the science subjects had a slight decline in popularity for the first two decades from 30% to approximately 25% but remained the same for the next two. During the last two decades, the popularity has slowly increased back to its initial 30% and became equally popular as medicine.
The line graph presents the data on percentages of students enrolment in three different academic courses at a Regional university from 1960 to 2020.
overall the popularity of medicine moderately increased as opposed to humanities experienced a gradual decrease. students which prefer on science remained constant over the given time period.
percentage of students enrollment in medicine considerably increased up to its highest value of near the 35% in year 2000 before it declines up to 30% in 2020.
Approximately 45% of students prefer humanities in 1960 but it declined remarkably to just under 10% of students which is one-fourth of its starting value in 2020.
students enrolment in science remained the same, that is 30%. It decreased slightly over the next 40 years, however, it raised up to 30% again in 2020 which same as medicine.
The line graph illustrates data of the percentage of student registration in three different subjects at a regional university from year 1960 to 2020.
Overall, the popularity of medicine rised up in shown time period while humanities enrolment reached a significant lowering. Meanwhile Science has stayed in a stable place during this time period.
The enrolment of Medicine started from 20% in 1960 anf got the top level in 2000 as 35% and then after slightly decreased to 30% in year 2020.
Humanities has started from 45% enrolment in 1960 and almost in 1970 started a significant decrease throughout the rest of time period. In 2020, the entire enrolment of humanities fallen down to around 7% and this is the minimum percentage of registration for each subject in the year 2020.
Science remained relatively stable, and started from 30% in 1960. The enrolments decreased fractionally over the next 40 years and finally returned in 2020 to the same percentage 30%.
Sir, can you have a look and please tell my score.
The graph shows the percentage of student's preference over three different disciplines which are Humanities medicine and Science in a particular University from the time range of 1960 to 2020.
The lines say that students liked to take Humanities previously which is decreased sharply While popularity for medicine and science has increased gradually from 1960 to 2020.
In 1960 students preferred to take medicine which is just 20%. Afterwards popularity for medicine has increased and reached its peak on 2020. Then it experienced a gradual decline from 35% to 30% on 2020 finally.
Humanities was the most popular subject previously. More than 40% student would like to take Humanities. But it faced a sharp decline from 45 % to 10% in the time period of 1970 to 2010. Lastly,less than 10% students prefer to take Humanities.
The line for students who enroll in science is more or less steady. The percentage of student who enrolled in science was same from 1960 to 2020 with an insignificant decline from 1970 to 2010.
I have written my very first report with your vdo lessons. This is really very useful. Keep it up. Do mark my write-up please and thanks a lot.
6.0-6.5
Hi Chris. Here is my answer of line graph. I have watch your video but l'm not imitate your answer. Please give the band score prediction so l could improve in certain parts. Tks. Gob Bless You рҹҳҠ
The chart shows the information about the percentage of three different field of studies that preffered by students at a regional university during 60 years from 1960 to 2020.
Overall, at the beginning of the period humanities was the major course and the minor course was medicine. At the end of the period both science and medicine became the highest intended courses, whereas humanities became the lowest preffered course by students. Medicine showed a increase while humanities experienced a decrease. Furthermore, science remain unchanged.
In 1960, the number of students who chose medicine as their field of study were 20% and increased to peak at over 30% in the year 2000 before decreased of exactly 30% in the final year, 2020.
In term of humanities, this field of study experienced a dramatic fall. Started at approximately 45% in the first year and then dropped sharply to hit a low of roughly 8% in 2020.
With regard to the remaining course, as much as 30% of students preffered this course. After this point, it showed a downward trend over 40 years from 1960 to 2000 and rose slightly at 30% in the year 2020, this amount was same that of the proportion in 1960.
Thanks рҹҳҠ
The given line graph elucidates the trending data about the enrolment at regional university in three most popular courses during the span of last 60 years.
The three courses enlist Humanities to be the most preferred one for the first 10 years while Medicine to be the least preferred. After these 10 years, there is a gradual regression observed for humanities, falling down to 7 % from 45% .
However, the Medicine course is observed to show a progressive trending in enrolment for about first 40 years, attaining an optimum peak of 35 percentile from 20%. This marks the commencement of 20th century as well and right after 2000, there is a slight regression observed, reaching to 30% as per the data in 2020.
The third course Science is observed to maintain a steady trend with attaining a regressive plateau in between for a period of 20 years. After 2000, the plateau broke and showed an up scaling, hence restoring back to 30% from where it started.
Overall, the present trend analysis shows that science is able to maintain its place abreast medicine while humanities has gone through a drastic downfall in preference, making it the least popular course for 2020.
I'll be looking forward to your response Chris!
TIA TO THIS CHANNEL !
I've done my homework. Please do check it.
The line graph illustrates data on the preferences of three different courses in a regional university by the students for over a 60-year period.
Overall, the proportion of medicine courses had a gradual growth on enrolments, whereas humanity had a downfall over the period. The science remains the same throughout the period.
Medicine has an increased popularity in the enrolments over other two courses, it started from 20% in 1960, had a gradual rise to 35% in 2000 and ended at 30% by the year 2020.
Humanities was at the peak of 45% enrolments in the beginning of 1960. Around 1970, this course started a significant downfall and finished by 7% enrolments in the year 2020 which is the least of all.
Science remains the same. The enrolments began with 30% in 1960 and slightly decreased to 25% in 1980 and there was no change in popularity in enrolments till 2000. By 2020, it reached the same popularity as medicine.
The best explanation ever.рҹ‘Қвӯҗвӯҗвӯҗвӯҗвӯҗ
Wow thanks
This is very good. Makes it simple and straight forward and you get time to even revise рҹ‘ҸрҹҸјрҹ‘ҸрҹҸјрҹ‘ҸрҹҸј
Thanks Anthony. Glad you like it
Hello! So I did it before watching your explanation, because I wanted to try it on my own. This was my approach:
The following graph informs how trendy are three courses at a regional university, for a time span of 60 years, starting in 1960 and ending in 2020.
According to the graph, the number of students choosing science has not changed significantly. Moreover, between 1960 and 1980 a slight downfall is visible, which stayed constant between 1980 and 2000, but began slowly to rise between 2000 and 2020, reaching the same 30% as in 1960. In contrast, the humanities studies are marked by a drastic change. The peak of this subject was between 1960 and 1980, with approximately 46%, whereas from 1970 to 2020 it has enormously fallen to 7% in 2020. Lastly, students interested in medical practices were 20% in 1960, increasing from 1970 and growing continuously to 2000, reaching the highest point at around 33% of interested students, followed by a downfall until 2010, and starting slowly to increase again by 2020.
I made notes about the paragraphs and the structure, but I am wondering if I didn't watch the video, what would be the score of this. Thank you so much!
5.5-6.0
@@IELTSDaily Thank you!
The line graph provides data about student enrolments in three courses over a 60-year period starting from 1960, in a regional university.
Overall, there was a gain in Medicine percentage and a exagerated decrease in Humanities popularity over this period, being science the subject that remained with a stable enrolment with a slightly flutuation throughout.
The percentage of student enrolment in Medicine accounted for the largest gain, rising 15% over a period of 40years, being initially in the 20% mark. By the 2000's it experienced a 5% decrease to a 30% enrolment that continues to this day.
In clear contrast, humanities experienced a large decline within a 50-year period. Starting from 1970, it lost 40% registrations in this university. Until then it had an enrolment of 45% and by 2020 an enrolment of 7%. Humanities became the most unwanted course over the years comparing too Medicine and Science.
Science, in other hand, had fallen to 26% by 1980, stabilizing at this plateau for 20 years and then rising up to the initial 30% enrolment. Becaming the course with the most stable enrolment and being as equally as popular as Medicine by the year 2020.
You are great sir рҹҳҚрҹҳҚ. You are promising teacher
Thank you :)
I write introduce phrase :"The given line graph illustrates the percentage of student enrolments in three different courses, namely medicine, humanities and science, at a regional university over 40-year period." It's ok ?
Make more about every part of writing part 1and 2, love from Bangladesh рҹҮ§рҹҮ©
We already have some videos
All writing videos didn't work i mean it's didn't play and download!
Here's my take on the writing, suggestions would be helpful and kindly give band score for this one
The line graph illustrates the popularity of three different courses in a regional university from 1960 to 2020.
Overall,medicine had the highest rate of enrollment among three different subjects by the end of the period while science maintained the same amount of popularity.However percentage of individuals enrolling in humanities drastically declined compared to other courses which relatively increased and reamined stable .
In 1960 the no of students enrolling in medicine was about 20% which steadily increased over 30% reaching its peak in 2000 before dropping down back to 30% in 2020
On the other hand, 30% of students decided to major in science in 1960 the rate of admissions fell down to below 30% in the year 1980 and 2000 which later rose up again to 30 %in 2020 .
Compared to other courses humanities was seen to have the most decline in its enrollment over the years . Above 40% students were enrolled in 1960 which dramatically dropped down to below 20% in 2000. By 2020 the percentage rate of humanities steadily decreased and had below 10% students enrollment.
The line graph illustrates the popularity of student enrollments in the three subjects Medicine , Humanities and sciences at regional university from 1960 to 2020.
Overall, the proportion of medicine experienced an upwards trend over the years, while Humanities enrollments decreased dramatically during the years whereas, the popularity of Science remained stable over 60 years.
Medicine enrollments increased and reached a peak between 1960 to 2000, which was from 20 percent to 35 percent, then it decreased slightly in the same year and finished in 2020 starting 29 percent to 30 percent.
Science , over the years relatively remained stable from 30 percent in 1960 and finished at 30 percent in 2020. However, in the year the popularity of science and medicine have same percentage enrollments for approximately 30 percent.
Humanities , experienced a very different trend the enrollments started in 1960 about 45 percent then continue to declined till 5 percent in 2020.
Could you sir review my writing
And how much l need till to get 6 ?
if you want to become a superstar member we can give you detailed feedback.
The graph provides data about the popularity of Medicine, Humanities, and Science in a regional university from 1960 and 2020.
Overall, the proportion of subjects has been changing among these years and there was a significant downtrend by humanities lesson. Medicine and Science lectures have declined and increased over the years.
For the medicine, It has started by 20% and continued to rise until 2000. However, it has decreased approximately 5% in 2020. Also, science lesson had about one-third in 1960, but it had a slight decline in 1980 and followed by the same proportion until 20th century. Eventually, science lessons had had the same percentage as medicine.
The last lecture, humanities is started by 45% in 1960{ approximately}. From 1970 to 2010 had a sharp downtrend which was nearly 36%. Finally, it rose about 6% in 2020
Thank you in advance!
5.5-6.0
Hi, Thank you very much . These videos are very useful.
Thanks Rajitha.
This video is really helpful , thank you!
Pleasure
The line graph illustrates data of student enrollments of 3 subjects in % at a Regional University from 1960 to 2020.
Overall, it is immediately apparent that among 3 subjects, the popularity of humanities experienced a dramatical decrease. On one hand, science remained unchange, while medicine increased slightly over the last 60-year period.
To begin with, humanities had the highest percentage of enrollments at around 40% and remained stable until 1970, however it dropped significantly and reached its lowest percentage at around 8% in 2020 and became the least popular course among the 3.
On the other hand, medicine shows an increased in popularity of course among others. Started from 20% in 1960 and reached its high of 35% in 2000, however it fell slightly in 2010 and finished at 30% in 2020.
Meanwhile, science remained relatively stable throughout the 60-year period, starting at 30% in 1960. Though it decreased slightly from 1980 to 2000 respectively, it returned to the same percentile in 2020 and having the same popularity as medicine.
6.0
Thank you so much рҹҳҠ
The line graph illustrates how popular were three different universityвҖҷs majors at a regional university from 1960 to 2020.
As can be clearly seen from the graph, the popularity of science remained stable at the end of the period, while the proportion of students who studied medicine increased. By contrast, there was a significant decrease in the percentage of people who chose humanities as their major.
In 1960, the popularity of humanities was the highest among all three subjects at 45% and the figures for science and medicine were lower at 30% and 20% respectively. In 2020, the figure for medicine was 30%, as equal as that of science, whereas that of humanities was lower at about 5%.
Between 1960 and 2020, the proportion of humanities popularity saw a dramatic decline of 40% from 45% to just over 5%. From 1960 to 1988, the figure for medicine went up significantly to 27% after which it exceeded that of humanities, picking at 35% and fell to 30% in 2020. Between 1960 and 2000, there was a decrease in the percentage of science attendances followed by a gradual rise to the same level (30%) in 2020.
Hi, I appreciate if you take a look at my writing Chris,
Thanks.
Score 6.0 to 6 5. Your body paragraphs have no clear or obvious organisation.
@@IELTSDaily thanks a lot. I wish I could improve it. I guess I have combined both methods( writing based on categories and grouping based on time periods) thus make it unclear.
Sir, I was taught that in my overview, I need to write down both the main trends and another features, like the highest or lowest line in the chart or the category that experienced the most significant change. So is it necessary Or writing about the main trends is enough? Thanks for your advice
A great viedo.
Sir, could I replace a word enrollment and write instead registeration in this task?
You can, if you spell it correctly вң…рҹҳҒ registration
@@IELTSDaily
Oh, I see.
A fact of matter I have a problem with spelling..
Any way, thank you a lot.
Delineated in the linear graph it shows a data of demand in three field of studies at a institutional sector in UK in 1960 to 2020. The values are detailed in years which have an interval of 20 years.
It can be clearly seen that, Medicine is the course of choice with an increasing enrolees and Humanities had a noticeably decline; where as, Science had minute changes through out the 6 decade period.
Looking at Medicine in 1960 it began at 20% students and it slowly gained in popularity which had nearly doubled its apprentices in 2000. however, it had a little interest in 2020 which tapered in 30%.
On the other hand, Humanities had a good start in 1960 gaining almost 45% of pupils and somehow it took a nosedive somewhere in 1970 from there it no longer recovered throughout 40years in service and ended up just below 10% in 2020.
lastly, Science garnered 30% in trainees in 1960 then a minimal decrease and plateaued for almost 20 year in 1980 to 2000. then it had a slow upward gain in 2020 going back to its original status in 1960.
5.5
@@IELTSDaily thank you sir, am nearing my exam date 2 days left and ill be in the hot seat.рҹҘө
Wishing you the best in your test.
Hello, teacher, please evaluate my essay. Thanks in advance.
The line graph illustrates data on the proportion of students who enrolled in three different subjects at a regional university from 1960 to 2020.
Overall, trends in medicine increased during the given period, while proportion of humanities witnessed a dramatic decrease. Science maintained the same level over the 60-year period.
Popularity of medicine increased over the period, starting at 20% in 1960 and reached a record high in 2000. After this point, it declined gradually and finished at 30% in 2020.
Humanities experienced a very significant decrease . In 1960 it reached a peak of 45%
After that, it continued a dramatic decline over the next period. Student enrollments of humanities went down to 7% in 2020, becoming the least popular subject.
Science stay constant over the period. In 1960 it had 30% of student enrolments. Over the next 40 years it decreased slightly. But, then enrolments returned back to 30% in 2020.
6.5-7.0
@@IELTSDaily thank you!
Thanks a bunch Chris, рҹӨ—
This is so wonderful, fully organized. But is it okay to say line graph as long as there are three line graphs?
There's only one "graph" with three lines
@@IELTSDaily Thank you Chris
Thank you Chris. вҳәпёҸ
You're welcome :) which other videos do you want?
IELTS Daily Courses: i am always watching your speaking videos because I am preparing to take the ielts for my visa screen. If you could make a video on the reading part. Again thank you for sharing your expertiseвҳәпёҸ
Hello, Sir. I would like to ask. Why did you use verb-ing for paragraph 3 (starting), paragraph 4 (becoming), and paragraph 5 (starting), instead of started, became, and started. I can't recognize what type of rule/grammar it is. Thankyou!
The graph show the percentages of students enrolments in three different departments from 1960 to 2020 .
Overall the percentage in medicine student increased whereas the average in humanities illustrated significant decreasing and science student enrolment showed steady movement over years
Medicine popularity starting at %20 in 1960 and increased slightly until 1980 also reached a peak in 2000 which is approximately 35% but experienced a decreasing between 2000 and 2020 and stopped at %30 .
Humanities faced an sudden downward trend, it started with 45% in 1960 and had decreased sharply then kept declining until nearly 2010 and finished with less than %10 in 2020
On another hand the enrolment of science student moved steadily, it started in 30% in 1960 . It has fallen gradually . Between 1980 and 2000 it has flowed consistently and in 2020 it finally returned to same rate
I started preparing for IELTS exam 2 weeks ago , l know itвҖҷs not too good but I tried my best to write this . I still have 2,5 months for my exam I will keep practicing :)
Now I canвҖҷt wait for my first score and thank you for the amazing lesson
5.5-6.0
The Line Graph provides information about how much students enrolled in medicine, science and humanities subject at a regional university from 1960 to 2020.
Overall, student enrolments percentage in medicine subject experienced an upward trend over the period, while the rate of humanities course experienced a downward trend
In 1960 the enrollments proportion of medicine subject was 20% and its percentage increased sharply in next 40 years, exceeding science rate in 1980 and reaching almost 35% in 2000. From 2000 to 2020 it decreased around 5% and end of the period 30% student enrolled medicine subject.
In early 1960, student enrolments percentage in humanities was almost 45% and highest among three subjects, however it dramatically declined over the period and reaching almost 7% in 2020.
Furthermore, at the beginning of the period science subject enrolments account for 30% . In 1980 it slightly decrease and reaching around 26% and next 20 years it remains same. Then it grew to 30% in 2020.
Which is correct. How many students or how much students. If I'm not mistaken student countable noun. That's why I think how many students are correct.
Maybe i made mistake?
@@yashnargafuro6931 youвҖҷre right, the correct answer is вҖңhow many studentsвҖқ.
What band score would you give your own sample answer?
Hi sir, I think I'm a bit late, but please do check my answers.
The graph above illustrates the fluctuation of the student's interests in a regional university, covering three subjects: medicine, science and humanities.
Overall, the data shows that enrollments in medicine increased, while popularity of humanities decreased significantly over the time period. Enrollments of science remained constant throughout the years.
Science is the most stable of all the subjects, only slightly decreasing over the period from 1980 to 2000, returning to its initial popularity in 2020.
Medicine initially was the least popular subject in 1960, starting out at 20% enrollments, but increased up to 35% in 2000. It has since slightly decreased, ending up at 30% enrollments by 2020. At the end, medicine became as popular as science.
Humanities, on the other hand, experienced a steep drop, from the initial 45% in 1960,and ending up under 10% at the end of the time period.
Sir, I have a question, Do i have to write the body paragraphs in the same order as the order of subjects in the overview?
And is it better to start with the increasing aspect subject or can i use any order?
Thanks!
Thank you very much for your video
Welcome - thanks for watching
Thanks, itвҖҷs so helpfulрҹҳҠ
Welcome Aashi
The line graph displays data on the proportion of the student enrolments in three different subjects at a regional university over a 60-year period starting from 1960.
Overall, medicine has increasingly gained its popularity throughout the period while humanities has seen a decline in student enrolments.The science course regained its popularity with similar rate as before.
Medicine was the subject with lowest student enrolments accounting for only 20% in the year 1960. This rate increased significantly and reached a peak in 2000 accounting for 35%. After this, the medicine saw a slight decline and ended to 30% in the year 2020.
The Humanities followed the opposite trend compared to the medicine. It started at highest student enrolments (45%) but, dropped its popularity drastically and reached to about 8% in 2020.
The enrolments of student in science showed a slight decline with 26% and 25% in 1980 and 2000 respectively. The change is not so high as it was 30% at the beginning (1960). Fortunately, the science made an increase and reached the same popularity of 30% student enrolments as before. It is also noticeable that, in 2020, both science and medicine gained an equal proportion of student enrolments.
I feel like I'm too late for posting it here. Though, I would highly appreciate If you could give your quick review despite your busy schedule. I am new to this and been recently seeking for a good IELTS preparation class on online. I find your site so helpful.
6.5-7.0
@@IELTSDaily Wow. thank you for your quick reply...
I could not see the PDF to download for the homework, please the link pls. Thanks