Scatter Diagram (Scatter Plot): Detailed Illustration With Examples

ฝัง
- เผยแพร่เมื่อ 3 ก.ค. 2024
- To learn Lean Six Sigma Most Effectively and Practically visit www.successfulcareerhub.com/p...
Hello Friends,
This video is about the Scatter Diagram (Scatter Plot), one of the most important quality control tools. I have explained these tools with the help of practical examples which will be very easy to understand.
The video consists of the following points:
✅Introduction
✅Scatter Diagram (Scatter Plot)
✅When to use Scatter Diagram (Scatter Plot)
✅Scatter Diagram Example
✅Scatter Diagram Considerations
✅Scatter Diagram In Excel
✅Scatter Diagram In Minitab
✅Matrix Scatter Plot (Scatter Plot)
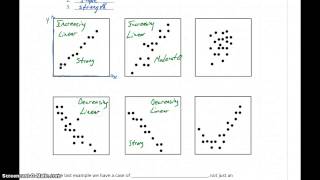
✅How to read Scatter Plot?
✅Degree of Correlation
✅Types of Correlation
I am sure, you will like it.
Some important links about LEARN & APPLY:
🏫 Know about LEARN & APPLY: www.learnandapply.org/
👨🏽🏫 Know about Myself (Trainer/Coach): vijaysabale.com/
🎥 Step 1- Register for my next LIVE Masterclass: vijaysabale.co/webinar
👨👩👦👦 Step 2- Join my community: vijaysabale.co/Join
You can also visit our Learning Management System (LMS) 📚📖📑 to access online courses at:
www.successfulcareerhub.com/p...
Join this channel to get access to the perks:
/ @learnandapply
0:00 Introduction of Scatter Diagram (Scatter Plot)
0:49 Scatter Diagram (Scatter Plot)
1:13 When to use Scatter Diagram (Scatter Plot)
1:58 Scatter Diagram Example
2:26 Scatter Diagram Considerations
3:35 Scatter Diagram In Excel
4:19 Scatter Diagram In Minitab
4:52 Matrix Scatter Plot
5:38 How to read Scatter Plot?
6:05 Types of Correlation
And finally, thank you for watching…
#scatterdiagram #scatterplot #correlation #graphicaltools #scatterplotexcel #sixsigma #learnandapply #successfulcareerhub #sixsigmaonline #minitab #leansixsigma


![CAMPปลิ้น | EP.77[1/2] ก็ไม่ได้ชอบเอาชนะ แต่เรื่องอะไรต้องแพ้!!](http://i.ytimg.com/vi/JraaBYOd7I0/mqdefault.jpg)
![แม่กลองสองใจ - ซีแกรม โตเกียว มิวสิค [ OFFICIAL MUSIC VIDEO ]](http://i.ytimg.com/vi/GSQfVjcr_f4/mqdefault.jpg)

Really very useful video for me...i was very confused between low and high positive and negative correlation ...but my doubt is cleared because of this video..thanks a lot😊😃😊😃🤗🤗
That's great!😊
Thank you so much for your valuable comments and appreciation!
Totally agreed, everything on this channel is dope 🤩
I am sorry, but what's the meaning of this?
@@learnandapply dope means it's sweet as candies (term used by younger people here in canada). I Luve it. I wanted to comment each video but am afraid it would be bothering. Thank you so much.
Ohh, thank you so much for your valuable comments, kind words, and appreciation! 🙏☺️
Very much informative, I was learning a Data Science Topic... But couldn't get a better explanation anywhere ! Thanks for the illustrative example
Thank you so much for your valuable comments and appreciation!!
Thank you. Very comprehensible
Thank you so much for your valuable comments and appreciation!!
Thanks 👍
Thank you very much, you have done is really well and simplified.
+Dr.Raghavendra Hallur
Thank you very much for your valuable comments.
In depth knowledge, you have shared....
Thank you so much for your valuable comments and appreciation!
Excellent boss... Heartfelt thanks
Thank you so much for your valuable comments sir
I'm flattered, because you have used in the video (at 3:00 min mark) the scatter diagram I have made for the performance analysis of several machines.
Thank you for your valuable comments and appreciation! 🙏😊
Thanks! It helped me a lot!
Thank you so much for your valuable comments and appreciation!
thank you!
Thank you for your valuable comments...
Even though short video but clearly explained the topic awesome bro
Thank you so much for your valuable comments and appreciation ☺🙏
Clear and simple sir
+MUKKADALA BALATATA
Thank you for your valuable comments
Very awesome video dude I understand everything that I saw in video
Thank you so much for your valuable comments..
Please share it with your friends and colleagues..
Nice sir
Thank you sir helpful for ese
+MUKKADALA BALATATA
Thank you for your valuable comments.
Please share these videos in your entire group.
Thanks you
You are welcome and thank you for your valuable comments 🙏☺
Thank you
You are welcome and thank you for your valuable comments ☺🙏
thank you
Thank you so much for your valuable comments and appreciation!
Thankyu sir
You're welcome and thank you so much for your valuable comments ☺🙏
Superbly explained
Thank you so much for your valuable comments and appreciation ☺🙏
Thanks
Thank you so much for your valuable comments!
Terima kasih
Thank you for your valuable comments 🙏☺
Terimakasih sangat membantu 👍
Thank you so much for your valuable comments and appreciation 🙏☺
Your videos are awesome! Thanks! :)
Thank you so much again for your valuable comments. Such a beautiful comments encourages me to serve you in a more and more better way..😊
Cool :)
very useful thanks for sharing :)
Thank you for your valuable comments
Grea learning
Thank you so much for your valuable comments and appreciation ☺🙏
sir i was looking for plotting with pen and paper not excel, exceptthat everything was useful
Ohh, thank you so much for your valuable comments and appreciation!🙏😊
Very helpful sir
Thank you so much for your valuable comments.
very informative even the thumbnail is usefull
Thank you for your valuable comments and appreciation! 🙏😊
really usefull
Thank you so much for your valuable comments and appreciation ☺️🙏
This videos are perfect... quick and concrete. Greetings from Mx
+Ahmed Karim
Thank you for your valuable comments.
Good explanation
Thank you for your valuable comments and appreciation ☺🙏
thanks
Thank you so much for your valuable comments
Very Nice explanation
Thank you so much for your valuable comments and appreciation 🙏☺
thanks broo
You're welcome and thank you so much for your valuable comments ☺🙏
Really useful👌👌
Thank you for your valuable comments
Thank Yau.
You're welcome and thank you so much for your valuable comments ☺🙏
M a researcher but finding your video as interesting and useful
That's great! Thank you for your valuable response and appreciation 🙏🙏😊
Very useful
Thank you for your valuable comments...
very good
Thank you for your valuable comments and appreciation! 🙏☺️
pls mention about spearman vs pearson
Worthy video
Thank you so much for your valuable comments..
Thank Bhai
Thank you for your valuable comments..
Yas i understunded avarytheng en dez vedio
Thank you for your valuable comments..
Please share it with your friends and colleagues..
Video is informative..sir can u expalin How to create scatter diagram in r programming
Thank you for your valuable comments and appreciation, but I don't know about r programming.
Thank you for this video. May I ask for more explanation on the scatter diagram considerations? Specially on the first part. Thank you!
Thank you very much for your valuable comments
The 1st consideration of the scatter diagram explained the importance of technical or logical knowledge regarding the field in which you are using scatter diagram analysis.
That means you must know the some basic part of the area (i.e. factors and their expected behavior) before using scatter plot analysis. If you don't have that, you can take a help of expert in that particular area.
Please let me know if I had answered your question. Thank you for this very important query.
It did! Thank you so much!
Good work. As you mentioned each dependent variable have multiple values but in your dataset only unique values are present. Does the scatter diagram plot the mathematical relation or it plots the function of x and y as in function there is only unique image for x?
Thank you for your valuable comments and appreciation! 🙏😊
Scatter Diagram is used to see the graphical relationship between variables.
For one setting, you can have one value or multiple values.
Nice info
Thank you so much for your valuable comments and appreciation ☺🙏
useful
Thank you so much for your valuable comments and appreciation ☺🙏
👍
Thank you for your valuable comments and appreciation 🙏☺
Any Defination For Dependent & independent Variable??
If an observation provides no information about the value of another observation, the observations are independent and if an observation provides information about another observation, the observations are dependent.
nice bro
+Sandeep Kumar
Thank you for your valuable comments Sandeep
wow
Thank you so much for your valuable comments and appreciation 🙏☺
in these four types of correlation which one will be satisfies the process
Thank you for your valuable comments.
Well, it depends on what is your goal for data collection.
Hi there. I'd like to build a graph that combines two different data sets. Data set one shows data over time, e.g. a percentage of users over week 1, week 2, week 3...etc, but data set two, which I got from a survey, shows how much a customer interacts with something over time, like 20% say daily, 25% say weekly, 30% say monthly and 25% say yearly. Is it even possible to combine both data sets into one graph? If so, are you able to point me in the right direction?
Yes, it's possible.
Are you using a Excel or Minitab?
@@learnandapply thank you for replying. 😀 I'm using excel.
Just click on one of the chart line and add it to secondary axis.
@@learnandapply thank you for replying 😀
The most irritating thing is it's background music 😡, but the content is very good
Yes, you are right. This is a very old video when I was just started. Thank you for your valuable comments and sorry for the inconvenience caused to you. 🙏😊
Ok
Hi ... where can I find the corelation of 3 case of scatter of diagram
Which you said ...you will explain in detail in next video
Thank you for your valuable comments.
See the video on "correlation and regression."
@@learnandapply thanks
Can anyone help..which graph will have r=0...a curved one or the Partial one at 6:06
You won't get r=0 practically.
The lesser the value of r (let's say 0.1), the larger the points' scatter will be. In the diagram, you can say it is represented by "None" (No correlation between variables).
@learnandapply Thanks for reply Sir and i do understand this for the graphs showing "Degrees of Correlation" but confusion is with "Type of correlation" graphs having Curved and Partial Graphs..just wanted to know out of both which will have r=0 in between curved snd Partial graphs since in Positive graph r= +1 and in Negative graph it will be -1 but what it will be in curved and Partial graph?
That will come to any value in-between. This depends on the data considered for analysis. You can predict a partial correlation from the graph (visuals), not from the value.
The Graphical representation is critical in both Partial and Curved Correlation.
good video, very helpful but the pronounciation what hard to understand
Thank you so much for your valuable comments and appreciation 🙏☺
For pronunciation, you can use subtitles.
Good explanation.. But personally somehow the Background music is distracting..for me
Education channels also now playing background music 😂
Translate to indonesia please
Hi Rudy, You can use Indonesian subtitles. 😊
Hindi accent was so heavy, I couldn't understand half of what he was saying.
Where had you seen the Hindi accent?
BHAI thoda Hindi bol Le....
+Raj Chauhan
Thank you Raj.
Soch raha hoon hindi me bhi video karne ka.
Aap ki comment ke liye bahoot shukriya.
Haa BHAI Karo to jo weak student hai unhe JYADA SUPPORT MILEGA...
+Raj Chauhan
Thank you so much for your valuable comments.
Lekin thoda time lagega.
No problem BUT TRY.....
Delivered far too quickly and explained little.
You can see the detailed session on Correlation and Regression to understand it slowly and in more detailed.
oh my ,This accent
You accent makes me laugh 😂😂😂
Thank you for your valuable comments 😊😊
Thank you
You're welcome and thank you so much for your valuable comments ☺🙏
Thanks
Thank you so much for your valuable comments and appreciation ☺🙏
Thanks
You're welcome and thank you so much for your valuable comments 🙏☺