Excel Data Analysis ToolPak - Building a Correlation Matrix

ฝัง
- เผยแพร่เมื่อ 25 ส.ค. 2024
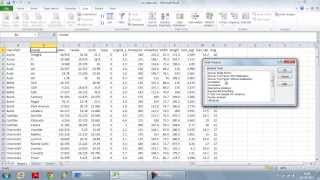
- We demonstrate installing Data Analysis ToolPak excel addin and how to build a Karl Pearson Correlation Matrix easily. The data set used can be downloaded from www.learnanalyt... .
Please subscribe to our channel to receive updates and also join our Linkedin Group for latest training videos and articles @ / learn-analytics-step-t...


Really simple explanation, no extra bs we didn't needed. You sir, have won the internet. Thanks!
I LOVE TH-cam. VERY EASY TO KNOW HOW TO DO THIS. THANK YOU, GUYS!
Easy to follow. Much better job of explaining than my professor.
I'm working on a capstone project and my data uses the likert scale. This video was an absolute savior! Thank you so much!
Thank you for sharing this demonstration of correlation matrix. Look forward to viewing your other videos as I learn more about the toolpak.
Easy to follow. Love it!
Nice, Simple , informative and interpretable.
Beautifully explained. Thank you so much for the video.
thank you very much for this wonderful video it was awesome...this video made my day..im so relieved...GOD BLESS YOU SIR
Brilliant video, gave me exactly what I needed to find out
@Aidan Anders No it didn’t
Excellent explanation and perfect clarity in explanation. Thank you sooooo much
Thanks in a million. Awesome. Very well explained. Where have you been all these years.A+
You are genius at teaching thank you so much!
thanks a lot, I finally find out how to do matrix in new excel!
Phenomenal video--succinct and informative.
Thank you so much ! God Bless you !
Thank you. Good explanation
Thank you very much Sir.
Sir thank you so much! your tutorials are wonderful! so much to learn :)
Subscribed!
Great teaching!
SO HELPFUL THANK YOU!!!
Thank you so much sir
Thank you this video is most helpful!
Thanks a lot, very clear video
Awesome video, thank you !
Very Helpful ... Well Explained
Thanks for great videos
thank u..for the add in part
Thank You Sir.
Very Useful
Thank you so much!
Thanks Sir
Thanks, this video helped me alot.
Excellent thanks!
Nice video. Thanks a lot!
very helpful - thanks
well done. love it
Awesom!!
Really helpful!!
Thanks a lot. Please let me know how I'll show this relationship significant or not
you're amazing..thank you
gr8 tip! Thank you
thank you its perfect.
How to export it in the same format?
MarketXLS works for me well for this.
So if my data is in rows, I would click the rows rather than default option?
How to generate correlation matrix map
thanks
Very helpful, thanks. Is there a way to get R2 and P values as well?
+Erik Eckhardt Excel doesnt give P values (you can try R), R2 is simply the square of the correlation (R)
great thnx
10/10
thank you for this.
my question is how do we know any of them is significant at 0.01 and or 0.05?
Excel does not give significance unfortunately; however you can check out rattle if you want a free tool.
Thank you. :D
Great tutorial
Is it possible to get a copy of the file for practice?
Thanks
available at www.learnanalytics.in/blog/?p=150
P value of correlation is not given in Excel. You can try R/Rattle
Is there a way to get a correlation matrix for ordinal and categorical, ordinal and continuous etc?
Recode all variables on the likert scale for ordinal, binary one hot for categorical and you are good to go. Use discretion in using the results though, as the scale you use will impact and can inflate correlation values. Use significance tests on the correlation values obtained
When I tried to run the correlation matrix I received an error message saying that my data range contained non-numerical data. What could that be referring to?
probably you have highlighted the Label Box of the variables without ticking the Label mark from the Regression tool box of options.