This is the 2nd dashboard that I worked on to be my practice/refresher for Tableau since I mainly use Power BI. Thank you so much for this! Really appreciate the effort! I hope your channel grows even more subscribers. Cheers!
It was a great great dashboard, it represents a significant amount of work but it definitely worth it. Thank you so much for sharing your knowledge, appreciate it, please keep posting.
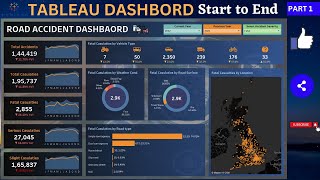
Great visualization !!! but there is some condition for the current year and previous year for ex- if we select 2020 as the current year we can also select 2022 as the previous year and visualization also change this not to happen otherwise dashboard is awesome !!! Thank You
Good question, to answer this, the filters on dashboard are self explanatory, also you need to educate your client on how to operate and read the dashboard.
Really great dashboard .. By any chance could you make a PERSONAL BUDGET TRACKER dashboard using TABLEAU?? It would be so helpful. Also teach us how to do ANIMATED DASHBOARDS..
@Datatutorial please i find it hard in doing the dynamics you did on the kpi for the fatal, using those icon . is it because i am using tableau desktop. when i clik on file i cant find those work. what can i do
@@datatutorials1 okay I will check there to see if it's there thank you .will get back to you. Is it a tableau server you use? .those shapes cars , buses can't replicate that under shapes on my tableau desktop .even when I reload them
@@datatutorials1 Yes. I found it though at another location and thank you. If anyone wants to know, its at - C:\Users\username\Documents\My Tableau Repository\Shapes


This is the 2nd dashboard that I worked on to be my practice/refresher for Tableau since I mainly use Power BI. Thank you so much for this! Really appreciate the effort! I hope your channel grows even more subscribers. Cheers!
I completed the dashboard in 8 hr. it's an amazing experience. thank you so much, sir 🥰😊
It was a great great dashboard, it represents a significant amount of work but it definitely worth it.
Thank you so much for sharing your knowledge, appreciate it, please keep posting.
Thanks for the comment, keep supporting 🙂
Nice, just completed start to end. THANK YOU !!!
Amazing walkthrough! More, please!😝
Learn a lot from your Dashboard creation. High appreciation for your dedication to share it for us 👍🤩🙏
It took me 9 hours finally completed started at 9 morning ending now at 10 pm ..maza aya bro ❤❤❤❤
Learning a lot from your dashbaord. Many thanks & great job!
Wow amazing dashboard loved it 👍 🤩
Glad you like it
You have to rename your title to Part 2. Great content btw!
thank you so much the dashboard helped me
Glad you liked it ✨
Thanks Man..Really Appreciated!! Great Work..I have made this project and ready to add it in my Linkedin Profile!!
Thank you sir ,our videos are very informative.
Thank you very much sir! was an amazing tutorial!!
Really great work, thank you vert much
Thank you so much! I learnt a lot. Can you teach on tableau prep too?
Thank you very much. Great work !!
your videos are helpful thank you
Great visualization !!! but there is some condition for the current year and previous year for ex- if we select 2020 as the current year we can also select 2022 as the previous year and visualization also change this not to happen otherwise dashboard is awesome !!! Thank You
Good question, to answer this, the filters on dashboard are self explanatory, also you need to educate your client on how to operate and read the dashboard.
14:17 I don’t have shape folder in my tableu. How? And where to move the images then?
If you are using tableau public then it won’t be there
@@datatutorials1do you have any solutions?
@yanazeng38 use tableau desktop versu
Thank you
44:13 why it is showing star for light conditions .any solution. In my dashboard: Accident Severity showing star. Please reply
is it because tableau changed to Attribute also make a detailed video regarding ATTR function
Same here, but when i use the filter only shows true instead of false and true
are you having the same on your end?
Really great dashboard .. By any chance could you make a PERSONAL BUDGET TRACKER dashboard using TABLEAU?? It would be so helpful. Also teach us how to do ANIMATED DASHBOARDS..
Really amazing Dashboard. What is your tableau name so I can tag you on tableau as the inspiration behind the design
🔥🔥
really helpful thanks
Glad you liked it ✨🙂
Excellent work, can you provide the kaggle link of dataset
when im putting select accident severity parameter into colour the shape is changing?
Sir Are you taking any class for tableau
how can we insert the shapes using a mac ?
@Datatutorial please i find it hard in doing the dynamics you did on the kpi for the fatal, using those icon . is it because i am using tableau desktop. when i clik on file i cant find those work. what can i do
You should be able to see dynamics, please check calcs again
@@datatutorials1 okay I will check there to see if it's there thank you .will get back to you. Is it a tableau server you use? .those shapes cars , buses can't replicate that under shapes on my tableau desktop .even when I reload them
I dont have default folder in Tableau and it also doesnt show Repository Location for adding images.
Are you using tableau public ??
@@datatutorials1 Yes. I found it though at another location and thank you. If anyone wants to know, its at - C:\Users\username\Documents\My Tableau Repository\Shapes
@@akshaypatel5326 Thank you so much😊!. I was also struggling with the same. Finally found it👍.
@@akshaypatel5326 does it work on tableau public?
@@niharika5161 Yes
awesome.... more pleasee !!!
Thanks for your support
can i add customize shapes in tableau public? having trouble here.
Sir actually there is no default folder in my tableau folder in C drive and there is no option of tableau reprosetry in my tableau..Please help me
go to document on your pc .You will see tableau repository there then click on shape
sir i have tableu public , i dont find shape folder, what should i do
You cannot add that in tableau public
Nice sir..
i am using tableau public and not able to find shapes folder could please guide
Public dont have shapes folder
if we had to use green arrows to show increase in yoy, how can we do that ?
Yes it can be done, you need to create a calculated field and then give specific colour
Done
You forgot to add avg in donut chart it showing (0)
Could you please make a vedio how to create a backend image?
Video already created and link available in comments section and in description box