What Is P Value In Statistics In Simple Language?

ฝัง
- เผยแพร่เมื่อ 1 ต.ค. 2024
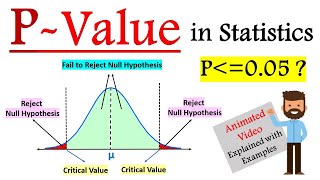
- In statistics, the p-value is the probability of obtaining results at least as extreme as the observed results of a statistical hypothesis test, assuming that the null hypothesis is correct
Subscribe my vlogging channel
/ @krishnaikhindi
iNeuron is coming up with the Affordable Machine Learning And Deep Learning Master Course. This batch is starting from 10th April and the timing will be 8am to 10am on Saturdays and Sunday and it will be live sessions.
The course fees will be 3000 inr+18% GST.
Download the syllabus and fill the form to reserve the seat
ineuron1.viewpa...
Download the syllabus and fill the form to reserve the seat, the support team will call you.
ineuron1.viewpa...
Incase of any queries you can contact the below number.
8788503778
6260726925
9538303385
8660034247
9880055539
-------------------------------------------------------------------------------------------------------------------------
⭐ Kite is a free AI-powered coding assistant that will help you code faster and smarter. The Kite plugin integrates with all the top editors and IDEs to give you smart completions and documentation while you’re typing. I've been using Kite for a few months and I love it! www.kite.com/g...
All Playlist In My channel
Interview Playlist: • Machine Learning Inter...
Complete DL Playlist: • Complete Road Map To P...
Julia Playlist: • Tutorial 1- Introducti...
Complete ML Playlist : • Complete Machine Learn...
Complete NLP Playlist: • Natural Language Proce...
Docker End To End Implementation: • Docker End to End Impl...
Live stream Playlist: • Pytorch
Machine Learning Pipelines: • Docker End to End Impl...
Pytorch Playlist: • Pytorch
Feature Engineering : • Feature Engineering
Live Projects : • Live Projects
Kaggle competition : • Kaggle Competitions
Mongodb with Python : • MongoDb with Python
MySQL With Python : • MYSQL Database With Py...
Deployment Architectures: • Deployment Architectur...
Amazon sagemaker : • Amazon SageMaker
Please donate if you want to support the channel through GPay UPID,
Gpay: krishnaik06@okicici
Telegram link: t.me/joinchat/...
Please join as a member in my channel to get additional benefits like materials in Data Science, live streaming for Members and many more
/ @krishnaik06
Please do subscribe my other channel too
/ @krishnaikhindi
Connect with me here:
Twitter: / krishnaik06
Facebook: / krishnaik06
instagram: / krishnaik06


Guys at 3:34 just a small update The p-value is not interpreted as a probability that the null hypothesis is true. It is the probability of observing a value of the test statistic that is as or more extreme than what was observed in the sample, assuming the null hypothesis is true. Dont Forget to subscribe my vlogging channel to see more motivational videos. Happy Learning!!
th-cam.com/video/H9Db7ADfcXI/w-d-xo.html
Sir can you please make a tutorial on the application of fastai framework ?
can you please explain what is then the difference b/w level of significance(alpha) & p-value
Also one more update, p-value isn't significance value. We calculate significance value based on observations and then compare it with p-value to decide if Null Hypothesis is accepted or rejected.
you need to delete this entire video rather than just correcting yourself in the comment section. A student who is new in this domain can easily get misguided.
Hey Krish,
The concept of p-value and null hypothesis in this video is completely wrong. Please don't mislead the students by teaching wrong concepts in public forum.
No offense, but please correct this because one of my students got confused by referring this video.
Thanks!
Ha ha.. Thanks. All along I thought fair coin simply means a coin which has a head and tail. I mean not a dummy coin like heads or tails on both sides 🙈
I am a doctor...and i bet very few medico knows about p value concept like you explained..we also need p value in biostats
P is not significant leve. It should be like alpha. P is the estimated probability for that 5% at given samples number.
Hey Krish please make 10 mins videos like this more on short topics. They are helpful for beginner in statistics like me.
Thanks & appreciate time you spent on great content.
Incorrect definition of p value. It is not the probability of null to be true. It is the probability of finding an extreme point if null is true.
Yes, it is not correct.
See pinned comment bro
(Doubt) Probability of finding extreme point where ?
Not extreme point but getting same result of sample again and again if null hypois true
Totally wrong concept its not the level of significance
Well explained Sir.
Nice
Definition: The p-value is the probability of obtaining a test statistic at least as extreme as the one observed, given that the null hypothesis is true.
Interpretation: It quantifies the strength of the evidence against the null hypothesis. A smaller p-value indicates stronger evidence against the null hypothesis.
Understanding p-value took so much time since other posts and videos don't involve animation of distributions in their explanations. I will say this is the greatest explanation one can ask for. Thank you so much, Krish!
No no no… pvalue is not the probability that the null hypothesis is correct.
Get your sources correctly. You will never find a book authored by statisticians that pvalue is the probability that the null hypothesis is true because it is NOT.
I especially loved that keyboard example...It's a kind of refreshment of concepts after watching your videos...
It got me cracking. All the people who have taught me never explained this concept as clear as he did. Wonderful teacher
p value is not the significance level :/
I also got confused.
I'm confused like why you performed 2 times, i.e. 60,67. I understood that 67 lies in tail region, but before why 60 was taken?.Anyone, please explain
The Coin in Sholay movie,, had p value less than 0.05 ,,and rejected the the null hypothesis,,, and rest is history
Krish ji, Understood the concepts, but not able to connect this example to the thing that we do hypothesis testing in sample to understand population behaviour.... pls someone clarify
Null hypothesis definition is wrong
It is getting same result if null hypothesis is true conditional probability is there
Most clear explanation on p-values and hypothesis.
Can I get an admission in bsc data science after 12th commerce in St Xavier's College Mumbai and I've mathmatics in optional subject ??? please please please please please please please please please please please please please please please please tell me...
Thank you so much, but just to share I slept like 8 times and each time i rewinded from 7:10
Excellent way of Explanation
Thanks for making this video.
Pvalue is one of the most important part in Data Science.
H0 means fair coin but the p is probabilty of head difference in the defn.
Are you from andhra pradesh/telengana??
Finally a video that explained what is happening. I managed to work out a definition from summarising your video.... thank you.
95% of all results will be average. However, 5% or less would be classified as extraordinary. Therefore, if your experiment gave results which are 5% or less than likely to occur on average, the independent variable you have manipulated is significant, because it changed the results from average to extraordinary.
Dude your the best, literally thanks a ton
06/03/2024 great information sir!
Why does sample mean uses n-1; Please Krish answer this one too.
Soon I will explain in a video
@@krishnaik06 thank you very much sir 🙌🏻
@@krishnaik06 I had tried to find this question but still I am confuse why n-1
Df of freedom ? N-1? You are talking about?
2:47 in the term of frequentist approach
Please make a video on the Mann Kendall test...
The above fair coin according to null hypothesis we should perform one-tail test.
We most of the time take 95% region of bell curve for not rejecting the null hypothesis, because of it is nearer to two standard deviations or anything else?
meanse between the confidence interval
OH god that was so easy ? thank you bhai
Please make video on ANOVA
Wish you had chosen a continuous variable rather than a categorical one!
Excellent Krish I had filnally clear my self.
Bro for ML+DL will you teach from basics
Because I did my master's in geology is there any chance of getting into IT industry
Thank you
Please check the concepts ---- I dont think definition of P Value is correct...will request the audience to cross check with other reliable sources
in one word ,amazing
Isn't it not a fair coin when the coin tossed 60 times head? Why do we need p-value to begin with ? How many times does the coin need to be tossed 100 times for us to determine a p-value?
if p > 0.05 is, then we can say that, we failed to reject that our coin is fair. Else if p < 0.05 is, hypothesis is rejected that our coin is fair. then point is that I want to make a correction. If p is equal to exact 0.05 value, means that we can not say whether it is fair or not.
It would be better if you could explain us with the same keyboard example and ofcourse it's easy.
Such a clear explanation about P-Value I have ever seen ☺ Thanks sir
it is really detailed and simple to understand...Thanks Krish
Super clear explanation. Thanks for making such a lecture.
Nice explanation. When you have time please explain how to combine multiple p-values from independent tests. That is combining p-values into a single test of a common Hypothesis. Thank you in advance.
Good one
Sir, can you please explain this “if the CI for the mean difference contains 0 within the interval -- i.e., if the lower boundary of the CI is a negative number and the upper boundary of the CI is a positive number -- the results are not significant at the chosen significance level”
Thank you
#StatQuest :)
Thank you brother.Excellent explanation ,writing doesn’t matter
Excellent explanation
Thank you so much sir . After watching this video I got clear about " P value " concept and really this is the best video I ever watched. You demonstrated it well sir .
If P = 0.02 ( or 2%) , does that mean null hypothesis is true by 0.98 ( or 98%) ? and we have to accept null hypothesis ? Please guide / help. For example the relationship between alcohol consumption and marks scored.
StatQuest and KrishNaik these two youtube channel just damn good for learning statistics.
Thank u so much sir
.very nice explanation sir .
Gr8 explanation🎉🎉🎉
How you have plotted the categorical data (head or tail) on a pdf
awesome explanation
thanx.....in simple way u explained everything
my god I have heard the pvalue explanation a lot but yours is the best. I keep on forgetting it because i truly did not understood it and only memorized (then forget the definition).
Your ada boost explanation made me subscribe few days back... you are
just too good man. Where were you when I took my masters?? 😂
Finally understood p value 2 months before neetpg
Awesome
Thank Youuuu! 🥲💙
Best explanation
Thank you sir
applaud, for someone write so well with mouse, besides the good content.
The best explanation that I have ever seen for the P-value. Thanks for your useful video!
Well explained
super presentation . full marks . excellent
Nice video Sir
Such an awsome video with very good examples.Thanks a lot for all your efforts for creating such an amazing video
Thank you!
if p value is only 0 what this mean?
Thank you for the good explanation
Do all data sets follows bell shape curved? If not how we will use t test and all that?
By the way, very nice videos.😊
Finally, the concept of p-value, null hypothesis are cleared. Thanks, Krish, your videos on DS and ML seem so fulfilling and refreshing , compared to the tedious DS+ML courses. Thanks a million, you are an amazing teacher!
so if p value is
Hello sir can you please explain weak law of large numbers and strong law of large numbers
The topic explanation is not clear.
Thanks
Thank you
Thanks for this video. Fairly easy to understand and very relevant analogy.
Thank you! it was very helpful.
hi sir can you please make video on meta-analysis ?
Best 😍
Thanks Krish, I signed up for your analytics course and looking forward to it!
Thanks Sir🙋🏻♂️👍🏻
Hey Krish, could you please explain how to interpret Logistic regression coefficients in the budiness terms. Linear regression coefficients is pretty clear to interpret but logistic regression log odds has bit hardtime to understand. It would be really helpful if you explain this.
The absolute best explanation I have ever heard!!
👍
Great Video...Very Clear Sir. Thank You
Awesome explanation…you got a subscriber sir🤙
u really explained in simple way
Best ever explanatory video I've seen
Thank you very much for this explanation! The graphical representation made it finally easy to understand it.
Thanks for making me understood the p value
Excellent teaching sir. I really understood.,.