Variance - Clearly Explained (How To Calculate Variance)

ฝัง
- เผยแพร่เมื่อ 3 ก.ค. 2024
- In this video, I’m going to clearly explain what variance is in statistics. I will also show you how to calculate variance by using a very simple example.
VIDEO CHAPTERS
00:00 Intro
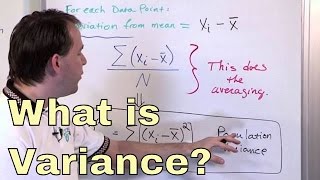
00:14 Definition of variance
00:28 How to calculate variance (example)
03:19 Calculating standard deviation from variance
03:54 Plotting the standard deviation
04:36 Variance for sample vs population
05:34 Summary
HOW I CREATED THIS TUTORIAL (AFFILIATE LINKS)
Screen recorder & editor techsmith.z6rjha.net/c/198849...
TH-cam SEO www.tubebuddy.com/SHTeach
Software (Microsoft PowerPoint 365 ProPlus)
FOLLOW US
Website toptipbio.com/
Facebook / toptipbio
Twitter / toptipbio
AFFILIATE DISCLAIMER
Some of the above links are affiliate links, meaning I will earn a commission if a sale is made after clicking on the link - แนวปฏิบัติและการใช้ชีวิต


super clear. to the point. no excess details! just perfect pace, flow, and details, wow!
absolutely brilliant! The simplest and clearest explanation yet, without starting with the equations too which just confuses people! You're a genius! Thanks
Awesome!
This video is perfect on each level.
You speak loud and clear,
Explanation are perfect,
The video devided to topics.
Thank you for your effort!
These are great videos you're doing here. I just started an online statistics course and your explanations have been helping out a lot! Thanks!
One of the best explanations of variance I've ever seen.
Finally a video answering my question in a straight forward manor. What I'd struggled to get a clear explaination on was both interpreting the variance/St dev as well as what there significance was relative to the average.
This was so clear. Super helpful. Thank you!
Thanks a lot. You are a great teacher sir. So easy to understand. Do keep sharing. You are helping people at large and contributing to their success.
Thank you 🙏 you explained it a thousand standard deviations better than my professor. You're a life saver!
love these kind of tutorials
Simple and clean, thanks
Very well explained. Finally understand!
Thank you! I understood every word!
Thanks for the very clear explanation.
Super cool explanation !!!! Thank you!
Cheers. It is very helpful (simple, neat, and elegant)
Clear and concise, great video!
Thanks for the feedback
Thank you. I understand so well the concept.
Thank you so much for this video! It is just perfect!
Well explained. I am working on spatial analysis of variance of climate datasets, this video helped me to clearly understand what variance is and where to apply!
Thank you for making a video that was so easy to understand that i was able to watch while trimming my armpit hair
Amazingly explained.....
Thank you so much! I have a machine learning and artificial intelligence module in university and I did not take focus on maths as one of my modules before university so I was really confused when I first encountered it. This helped me understand it a lot and you talk very clearly and concisely.
Massively helpful thank you
Concise and complete
i wanna say thank you so much that im crying because now i really know what variance and standar deviation is😭😭😭✨✨✨ your explanation is everything! this helps me a lott!
Awesome video thanks for the video, dear! 😎
Thank you very much, with your videos I have been able not just to understand, but also to love more statistics.
:) Greetings from Mexico.
Excellent! Thanks for the feedback Frida
incredible, thanks a lot
thanks and well explained
Thank you ❤
Awesome nicely explained ❤❤
nicely explained
Amazing!!!!
Thanks awesome explnantion
Thanks,so clear(:
Thank you
Just awesome!
wow, super clear.
thats great... thanks.
thank you!!!
Tq sir very good explanation
excellent
Thanks
Question: Why variance? I understand why Standard Deviation, but how does using variance clarify our data for interpretation? Thank you for the great video.
i have the same question, i cant find it anywhere on the internet
You're right I've been searching for an explanation to this without finding a clear answer, I only found out that the Mean Absolute Deviation is more inituitive measurement of spread for me...
@@tahaanouar2453 ive found the answer, variance is needed because further in statistics the variance should be the same between multiple variables. (variables that you set up against eachother) if one variance is bigger then the other your fucked. So for now remember that this is something for example a anova test.
thank you
THANK YOU!
Very welcome
Good explanation
Would be better if you could include maybe 3 to 5 examples so we have a better sense of how it works
My guy did something in 5 mins that my uni teacher couldn't do in 3 months🤣❤
great video
Tnx
Hello. Great video. I am curious what benefit using variance has over standard deviation. In what situation would I use variance instead? Thank you
So fucking good, never stop
Finally! Statistic basics, where I doesn't fall asleep.
Whey we need variance and where do we use ? Please explain. It was good explanation.
Essentially variance’s only use is to calculate standard deviation, which is actually helpful to interpret data 😂
HAHAHA THIS IS THE CONCLUSION THAT I HAVE ARRIVED TO
Right?!
Literally 😂
You're right but it's a little more complicated than that.
The variances of independent variables can be add up, but the standart deviations can't (because when we take the root of each variance individually and then sum them up we get a biased result)
Also the variance has plenty of mathematical uses, which the standart deviation can't achieve.
Hope this helped
It’s also used when determining standard error, which is used for determining margins of error.
Very well expained
Thanks :)
@@StevenBradburn no, Thank you.
First of all, great video. Second, can u please explain why we get ZERO if we don't square. Thanks 😊
Really good video. One question. When can we say that the variance is low or high? is there any kind of global value to refer to the data when the variance is low or high?
Really good video.
That is one definition of The Variance; here is mine: it is the rule by which one dimensional scalar data is converted to two dimensional data to map one dimensional (linear) data into two dimensional (probability) space. It is based upon geometry and Pythagorean Theorem. Does that make sense?
Here is another definition: it is a square in imaginary space, the area of which is the sum the areas of all the individual variances, and it is a two dimensional probability space. We calculated it was integration.
We can reduce the space from two dimensions into one by taking the square root of that scaler. That is the standard deviation. The standard deviation is the square root of the variance.
2:48: 28.4 is the radius of the circle in the space that was constructed from the data. It is the hypotenuse of a triangle that was constructed by adding the “Areas of Deviance” from the data points.
3:00 Because the Variance is the hypotenuse of a triangle that was constructed from the products of right triangles, we may use The Pythagorean Theorum to calculate its length by finding the square root.
YW! Upvotes please!
How would to represent variance using a two dimensional graph & what would it represent? How would it be different from that of Standard deviation?
@@Sam-vz8gn I made a mistake! It is the standard deviation that is the hypotenuse: The standard deviation is the square root of the variance!
I am in the process of re-writing my post until further notice…
What is the value of Standard Deviation were the observations are the lengths in days of the 12 different months in a leap year ?
Hi, i have a line of data which consists of these numbers {4, 3, 5, 6 ,4, 5, 7,6,5,4} and i have Mean = 4,9 and the variance of 1.4333. My question is, is this variance considered high or low ?
I don't know how many ways there are to calculate the variance but I calculate it by (EX^2-(EX)^2/N)/N
king
The “n” of the population variance should be “N”
Is there a easier way to find the variance
Is there a easier way to get 5he variance
Supposed to be divided by 6?
If I pull a card to try for the ace of spades (1/52 chance) and I win $500 each time I do, and $0 all the other times, how do I calculate the variance? each pull would be 1/52 (not 1/52 then 1/51 then 1/50...)
Are the data points really obtainted from a sample population ? Why did he consider all the data sets in that case?
This type of explanation, I called them " BULLSEYE EXPLANATION " !!
please tell couldn't we have just taken sum of absolute values rather squaring them
But why n-1.
cuz the mean has been subtracted from each value, so one less value.
Variance ---> SD ---> SE
Welcome
I don't understand one thing .......why should we square the values that we have subtracted from mean.........I am tense about this question
If you don't square, the sum would be zero. To avoid that we square and add them
@@harisudhan8481 Yeah your right....!
@@harisudhan8481 But can't we take values as it is!!??
Jay Pillai gang
hej
I'd not understand about standard variance
Why 6-1
sample variance = n-1, population variance = n
You did nothing explained for whole of the video
I think it’s maybe because your English is not good enough to comprehend what he is teaching.
@@Franckzzznah my english is pretty enough to understand these type of videos but in the video he explained nothing he just showed us how variance is calculated. This is not an explanation of what variance is.
Thank you
thank you