Candlestick Math - A New Way Of Using Candlesticks

ฝัง
- เผยแพร่เมื่อ 1 พ.ค. 2024
- When two single candle lines are combined, the meaning on the chart can become much more significant. You'll get an even sharper view into the psychology of the market - and the potential for a market reversal. Blended candles go hand-in-hand with multiple time frame analysis, which is a skill you need to better identify the overall trend of the market and generate rock-solid entry and exit points.
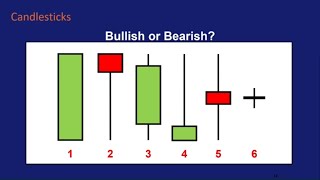
Candlestick patterns are made up of one or more candlesticks and these can be blended together to form one candlestick. This blended candlestick captures the essence of the pattern .


Great video. I watch several youtube videos on how to trade in the market but haven't made any headstart because they are either talking some gibberish or sharing their story of how they made it and I do not want to make mistakes by taking risks in my own hands
IF U WANT TO LEARN PRICE ACTION , THE CONTENT OF THIS VIDOE IS THE BEST FOR BEGINNERS AND ALL THOSE WHO DONT UNDERSTAND PRICE ACTION FUNDAMENTALS .
THANKS U VERY MUCH SIR .
Great idea!
Compacting flat candles into one result
I always used blending candles but never actually knew the name for it. this is good stuff. looking at different time frames from 30 min to an hour to get a different opinion is also super smart bc candlesticks is the best indicator!
Thank you. I’ve watched at least 30 videos and your video is the only one that explained exactly what the wicks represents 👏🏾
hello
That's true
Same here 😄
This math really makes sense. Especially in a consolidation area.
My trading career will never be the same again after this video, thanks a lot, may you live longer to share more wisdom
Hi, how is your trading career after 9 months of this video? I would like to know your feedback
@@gajanankakde1131 he vanished since then 😂
This is just beautiful and something to know for any novice trader
If you watch and apply what you learn in this class you will trade successfully PERIOD. The best video PERIOD.
With this explaination all those clouds hovering over my mind for long cleared up .... Thank you sir ! I must say I owe you millions of thanks
Everyone wishes to be able to at least make $500 to $1500 daily, now you can make it happen, learning *The Huon Fresne Strategy* is how i was able to achieve this target, just google it.
and dollars lol jk
THANK YOU,i wish you good healthy and clear thoughts to educate more
Explanation was great, removed a lot of fog from the road of understanding...thank you.
Very nice video on Candle Sticks analysis. Thanks 🙏
Thanks ..very nice videos with interesting ideas. But as we add up the candles, what we are doing is in effect doing moving averaging or averaging with different time periods. of course, information contained in such adding up richer than just moving averages.
appreciate your effort sir, thank you!
Thank you so much for this content! I have purchased numerous courses and not one has explained the candlestick to this degree, and for me it has been the missing element in understanding charting, so far.
U making bank yet?
Thanks for fantastic information. Great learning today.
Very different concept of looking at candlestick patterns. This shall definitely add an edge to trading to success. Thanks
This is what I was looking for. I have never ever been seen such a deep and clean explanation on Candlesticks. Hats off , Long live and Good Bless You. Like & Subscribed.
I'm a new studying trader and thank you so much for your surprising video, you are the best one.
I'm a beginner, thank you for your beautiful explanation.
Thank you so much sir
I found it realy helpful☺
The problem with this is that if you just move a few bars back in the consolidation, the blended bar could easily go from Red to Green and vice versa. It's easy to analyze an already printed chart. Try doing this live and it's a whole different story.
i highly agreed you bro, they're really different once we are in live trading.
Agree with you. I'd have problems not knowing which is the first candle. Great video though and one worth back-testing.
Green and red candles really don't make a difference.
Amateurs think green means good, red means bad.
It's usually the opposite.
However, when a bar is near the bottom of the range, you want to buy down red candles near support. Even if you were to see a green candle there, it would probably still be a red candle on a longer timeframe since it's near the bottom of the range.
The important thing is to understand support/resistance well.
Changing the time frame can easily change the color. Everything in everybody’s tool box has a nuance and interpretation is always subjective. Being open and available to register anyones perception helps validate your on beliefs whether or not in agreement.
It seemed like he was saying it was all about the tail, if it was longer on the top its heading down and if it is longer on the bottom it is gonna head up. Is that right??
Very visual explanation! Luv it
Thanks for this valuable information
great video been learning on how to trade for 3 years and first time got this thank you so much ! keep it up.
Hi
I cannot state the importance of volume enough. Engulfing candles with increasing volume show change of mood with increasing intensity. Of course the opposite can be sabout decreasing volume. An engulfing candle with decreasing volume means the engulfing candle direction is losing steam. 🙂
Thanks very much. I have learnt some new and amazing today on candlesticks patterns.
Wao......glad I ran into you.... YES I was not getting info. when toggling with times to give me insight into the 'next move' this should help me.........The math does not lie. Note: I am a total newbie
mind blowing video. thanks very much sir
Thanks, this was exactly what I wanted.
middle of the video just dropped by to say thanks for such an amazing video...
Thank you very much, this was great information!!!
Very very good informative video. Keep the good work done for novice traders.👍👍
Thanks for your kind explanation about candles
Great explanation. Great value. Thanks for sharing your talent and knowledge
with us.
thanks man a very different and a needed form of perspective!!!
This technique looks like getting onto a higher timeframe but only on chosen key areas like consolidation so we can see what happens there and what is not necessarily shown in the higher timeframe. Seems legit!
Perfect explanation!
Quite Nifty Approach... seeng a range or inside bar etc as a composite can help you appreciate the net trading sentiment so: bearish-indecision; bullish-indecision; bullish-decision or bearish-decision are useful composite candle descriptions that can help: see the net sentiment even if you are trading range break-outs. Say Tokyo session: from one day to the next, Looking at those ranges as composites is another approch to sering where bullish or bearish pressure is... thanks and have a blessed trading career.
Very interesting will watch again.
Yes. It is a new way of looking at candles!!!
Youre amazing sir. Great to share your knowledge.
Hi
Wonderful video
Great video thank you for sharing!
After watching every stratergy its my habit to pause the video in between and go to the charts and try to exercise on the same..some stratergy have got potential and some have not..but i don't have words to explain how i am feeling now..this is really working guys..everything you have to do is apply 20 period exponencial moving average and work on it..if you are a good chart reader then you will understand what i mean to say.. ❤️
m a beginner . plzzz tell me it work on bank nifty? and how ??? plzzzzzzz
Interesting. To your knowledge is there any charting platform or technology that does this kind of math for traders?
Thanks. Nice information. God bless you
"MIND BLOWN" great video
This looks a game changer. Have done a quick analysis, its adding up. Very useful strategy.
VEERY GOOD VIDEO TUTORIAL...
Thanks Beautiful Video
Very very informative video, thank you so much.
Really enjoyed this video and it was very easy to comprehend to make profrits
Hello Berry may I please ask you for the cheat sheet. I need it to gain knowledge please.
Great video... Thank you ❤️
Please, is it possible to trade using a 5-second frame without using indicators by taking the opportunity to enter the time 35 from the minute
thank you very helpful
Great explanation
thanku somuch sir
Excellent explanation also works with Iq option
Excellent fascinating stuff!
good knowledge ..what TF is best suitable to use candle stick math ..Thank you
Holy smokes, I really got a lot of value from this video. What is the name of the presenter that uses the black background chart and red/green candles, who's voice a bit hard to hear? Thanks
I agree. Give us the name please1
Explained nicely
Thank you so much sir
I'm Karthik From India
Does it work fr digital options
Heikin ashi candle gives same output .. check 15 min candle consolidated as 1 30min heikin ashi candle removing noise.
So... basically, using multiple time frame analysis provides different pictures of price actions, allowing an individual to glean different perspectives? Count the consolidation candles and multiply that number by current time frame to acquire "Combined Candle" ie 20 range candles on a 5 min chart = Doji on 1 hour
where can i find cheat sheets for your tutorials? iom watching more and more of your videos and would like to follow it deeper. thankyou very much
great subject where to get the file download for the lecture ....many thanks
All well and good in hindsight but you could pick any group of candlesticks and it could tell you the opposite of where the stock is going.
Eye opening !!!!!
Great content!
So this is mostly done in consolidation?
Thank you
Thanks it was so educative all I can say I have learned candle sticks math
Well,thanks. It was helpful
Leveraged synthetic indices offer the potential for amplified returns but also come with increased volatility and risk, requiring careful consideration of the potential downside and suitability for investors' objectives.
It’s not a new idea!! It’s been around since candles were discovered. It’s called a blended candle. It’s in all of Steve Nison’s Books who is the pioneer that brought candles to America.
i like this video, this man talk like a teacher😀
If I am trading on the 1min timeframe, which timeframe should I be looking at?
Smart content.
What i dont understand, is that all this analysis seems to be done after the fact. How can this be done real time? Do you use the last candle then go back to a change in trend?
On point👌...thats wht i fail to understand also
Exactly
You don’t buy after you add up the candles stick, instead use it to help you understand the trend Direction
Nice one.
I can not see how it is not simply giving you the next longer time frame. (3 - 1 min candles gives me the 3 min candle- same as my software.) Am I missing something?
What you seem to be missing is that this candlestick math technique gives you the ability to look at what one might call "custom" time frames. For instance, I can't pull up a 16-hr chart on TradingView, but I can add four 4-hr candles together.
That said, I feel like I may be missing something, still. I wouldn't be surprised if trading platforms come to offer pretty much any time frame one could imagine for their charts. Maybe some software already offers this?
I'm also waiting for a point in the video where he gives specific scenarios in which one would benefit from applying candlestick math ...
Please share that link to that TH-cam channel or video you talk about at beginning of your video, please
Amazing Video .
great! i like it
Thank you so much....
Thank you very much
This is cool. I don't know why I thought about blending candlesticks before, but it makes a lot of sense.
Question, can you blend the candles vertically, that is blending ask and bid candlesticks?, or even ask and mid candlesticks or mid and bid candlesticks?
Edit: Just realized that's a dumb question. Since blending candles vertically like that would give a new single high and a new single low, but would still leave multiple open's and closes's.
Thanks
Great Info everyone should know if trading!!!
Just sweetch 5 minute to 30 minute we can find 6 candle combination in single bar so easy why manually adding and conclude and confuse counting + bars and result?
100% correct Sir chutiapa bataa raha hai yeh toh. Making things complicated when it is so simple as you explained
Hey which link he named @ 48:51?
Pls share if any one understands...
Really helpful
What time frame is accurate
15mns.
Sooooooo just go to a higher time frame. Got it thanks ✅
Im not getting your video alerts I have to look for them manually even though I rang the all videos bell on TH-cam.
I dont get your videos when i keyword Cryptocurrency on TH-cam as well
Do you have a trading course?