I'm currently processing my undergraduate questionnaire information for my dissertation, I chose to use excel because I couldn't understand SPSS. This video was of sensational help, and I wanted to say thank you very much.
Can not explain how much this vide help! I actually created a youtube account just to say thanks ! was excellent ! deadline day tomorrow you saved the day.
Thank you so much. Just started a Clinical Nurse Educator post ( and Excel) and was cursing myself for using Likert on a staff survey. All is well now thanks to 'named data sets' and COUNTIF. If you ever need any advise on ... well, nursing, don't hesitate!
This helps me so much with my 40 pre-coded questions i have to convert from the surveys i received back and now i can put them into a excel spreadsheet like your example!! THANK YOU! This is for my college research project on my company.
I want to tell you something, these answers on the sheets could be entered by the user behind the scene. Example: when the user is answering the survey, answers would populated plus calculation at the same time. Then when you need to open/visible the answers, you open it with a password. I made a project like that 20 years ago. I lost the file, backup when I moved to another dept at my job and I don't have the file. All I remember was al lot work, but very rewarding. I had to transform the questionnaire in word into excel, exactly the way it was, then I applied codes to feed the behind scene answers sheet. The result is a breeze. I think the code was like this: if q1 is 1, or 2, 3 than do this, if q2 is this and that insert this and that.
Hi Deidre, I agree with everything here, but when you are naming those columns at 4:20 onwards in this video, my heart broken seeing you naming all those columns one by one. Instead you can select all those columns i.e. B1:O26 whatever and press Ctrl + Shift + F3, it will ask you whether you want to name those columns using their respective headers, say OK for that. Bang...you already named 15 columns automatically without wasting time on selections and naming. Very useful video. Thanks...cheeers from India.
Thanks... It helped me a lot. This is a great tutorial. I have a urgent quarry... Here you demonstrated us about one answer against one question. Please would you tell me that, if there is more than one answer against one question how to input those value and process data... If will be a great help to me if you reply shortly.
+Tanvir Klion I will also like to know how to input those with more than one answer and process the data.Did you come across the video? if you did please share. I really need that.
Many Thanks. This was helpful indeed. Is there a method/formula to compile all the different sheet (questions) into one data or table? Will be good to know. Regards.
Not quite sure what you mean Sunil. At 1.37 on the video there is a table with all the results. There is no way to chart all data in some sort of chart that I know of. Maybe I am misunderstanding your question. Regards, Deirdre
This is really in informative and useful tutorial. Thank you very much for sharing and teaching this to us. Later, I have a problem if possible to suggest of recommend any video of you, or you can teach me here. The problem is, if the question has a multiple options to be chosen (For instance, if the question asked to the respondent to chose any option or answer you think is suitable, in this case the respondent may chose more than one option) so how to get such results from a survey (Questionnaire)? This is not applicable for all questions but just few in the whole survey. I thank and appreciate in anticipation.
You have to think about how you want the chart to look in Excel. You would probably like a chart that shows the total number of people that chose Option A and B and C... I would have a separate column (like a separate Question) for each possible Option. For each person that chose a particular Option I would type a 1. I would then total each column (adding up all the 1s) and use the headings and these totals only for the column chart.
+Deirdre Macnamara I have used this video,it helped me a lot .But it does not show how you create the graphs or pie charts after entering the data. Does one follow the same process as from your video or its different. what do i use for analysis? Need your help
Hi In Excel the creatina of Pie charts and Bar charts are really the same as Column charts. You just select Pie instead of Column. I have an older video doing pi charts th-cam.com/video/lQV6gz03q9w/w-d-xo.htmlm40s thay might help. Deirdre
As indicated i have entered multiple answer items in excel and i am now stuck with the next step of analysing the data. coming up with pie charts. Do i follow the same process as doing pie charts for single answers? Do i use the countif?
Just want to ask, im doing a questionnaire and i have one question where they rank three options from 1-3, how do i pu t that in a questoinnaire because its not just one answer, they all put three topics in a ranking order from 1-3 (3 being highest)
This video helped me so much! However, I have a question, if I add another question or change the information to the questions on the Data worksheet, will it show up on the other worksheets with the charts?
OSCAR RAMIREZ All you do is select a larger area for your range in in your countif function area with space to add more data. It will be ignored when blank and will only be counted as you add data.
Basically i'm trying to analyze a survey and i have race, age, town that they grew up in, education, and 7 questions that are agree to disagree. Do i add all of that data into a single spreadsheet? or one for the demographic and one for the agree to disagree since it's several answers to several questions.
I would put all the raw data from the questions on a single sheet and then just to make the graphs easy to find I might put the graphs on separate tabs in the one file.
Hi , I am using this method to analyse my findings. Can you please advise what type of technique is this ? What is the name of this analysis ? Thank You Very much.
+Deirdre Macnamara This video has been very helpful. I have used it to analyze my findings which was just one variable.I have just finished entering my data which had questions with multiple variables. I am now stuck as i don't know how to convert this into pie charts or bar graphs.How can i do this?
Great video! I was able to use this at work. Question what formula would I use if I wanted to know the names of the people who for example rated question 1 a 4=strongly agree. Any help would be greatly appreciated.
Hey, I wanna analyze data for 10 participants ,compare right , left foot to find out which foot is better , in antropostero ,mediolateral, can help me how begin analyze this data ?
Yes. You can do a lot of things in many different ways in Excel. The point of this video is showing you how to enter the information into Excel and how to get a graph with very few Excel skills.
Deidre, as already echoed below, thank you for this easy to follow tutorial. Question for you though, do you have an equally easy to follow tutorial for instances where respondents may choose more than one option?
No. Afraid not. Each option should be stored in a separate column. I think the only easy way to do that is to show each option as a separate chart or just chart the totals for each option. Hope that helps.
Unused google forms and as people answered my survey it calculated the results . I have answers in % and in numbers! All I need is to get the men mode standard deviation etc! How do I do that ?
I have followed your steps and everything went well until the countif selection at 7:58. When I "ok" it says I have "not enough arguments". I have tried to everything over again and again and still the same answer. What is the problem here?
Hi Stephen, Not sure what the problem is Countif has 2 arguments; - Range - Criteria Does it recognise your range? (see video at 7:36) (Look at the right of your dialog box (pop up window) and do you see something like (2,6,7,2,3,4,1,1,2,4,5,) If it doesn't understand the "name" you can manually select the data Does it recognise your criteria? If you used a cell reference like C1 does it know what to count. See video and I have highlighted at 7.57. Hope that helps Deirdre
Deirdre Macnamara Thanks for the response. It wasn't recognising the range at first, but I have managed to do it at last. Thanks again and keep up the good work Steve
I have a question, it may seem unrealistic to show every percentage of each question. In my case, my survey has 43 questions in total, the respondents were only 9 of them. Therefore to show all 43 questions with pie charts or column bars will take too much space on the final product: my graduate thesis. Is there a solution to generalize the results which I can include on my thesis? (not having to convert every single questions into charts). I have 3 choices per question though.
If you can do it with pen and paper you can usually do it in excel. If it is always the same 3 options for each question then a stacked bar might work.
Hi Deirdre! Thanks for your help. Q: What do you do if your survey responses are not mutually exclusive? I have a survey question that reads: "Which community groups are you active in, check all that apply" and I coded each community group with a number. When I code a response "1,2," for example, the countif function doesn't count any community groups at all / pick up the response. Any advice or follow up tutorials on this would be wonderful! Thanks!
Hi Melissa I would have a seperate column for each possible group and only 2 options 1 for yes and 0 for no. then you can just sum all the yes answers. Hope that helps
+Marco Briglia You can define names using the ribbons as well. Select The Data Tab and in the "Defined Names" section in the middle click on Define name. D
I have followed all the steps and all is working well; however I am having an issue with the number of responses. I have received 22 survey responses and have input all of the data. After setting up the all of the countif functions it is only recognizing 21 survey responses. I have double checked to make sure each survey was entered properly. I definitely have 22 rows of data.
Hi Jayke, I just used the fill handle (Solid black cross in the bottom right corner of the selected cell). Mine worked because the data that was being examined (answers to question 1) was held steady because it was "named" and the thing being looked up (answer options) was a plain cell reference that came down with me. Hope that helps
This was really helpful! Thank you so much. I just had a question: If I wanted to do a further analysis e.g. chi2 test, can you use the numerical equivalent e.g. father q1: 1= No education compared with Q3 sibling 1=yes ? Would the numerical number be valid when doing correlation test e.g. does having your father have an undergraduate degree mean your sibling is also more likely to as well?
Each of the 2500 questionnaire are on separate rows and each variable is a separate column. Remember the variables should be number coded with for example Age 0-10 typed in as 1 Age 11-20 typed in as 2 etc. Regards


Have been struggling for a week to find a way in Excel to compare data from my masters thesis research project. This video was a life saver!
9 years and this vid helps me with my assignment today.
Thank you so much for this. I was confused on how to enter data from questionnaires into Excel but your tutorial just made it so clear for me.
Thank you. I am working to compile data for a research project and was unsure how to do this. Your tutorial was exactly what I needed!
I'm currently processing my undergraduate questionnaire information for my dissertation, I chose to use excel because I couldn't understand SPSS.
This video was of sensational help, and I wanted to say thank you very much.
SPSS is very simple to use
I am working on my dissertation and I was very stressed about this part. Your video was of great help. Thank you so very much.
Can not explain how much this vide help! I actually created a youtube account just to say thanks ! was excellent ! deadline day tomorrow you saved the day.
Thank you so much. Just started a Clinical Nurse Educator post ( and Excel) and was cursing myself for using Likert on a staff survey. All is well now thanks to 'named data sets' and COUNTIF. If you ever need any advise on ... well, nursing, don't hesitate!
Best of luck in the new job!
This helps me so much with my 40 pre-coded questions i have to convert from the surveys i received back and now i can put them into a excel spreadsheet like your example!! THANK YOU! This is for my college research project on my company.
Great.
Very Helpful, Appreciated.
Thank you so much. I was really in need of some help in creating the chart. Your video gave me proper guidance as to how I should proceed further.
You are very welcome
i liked the easy way you explained many thanks for your contribution to our career may Allah guide you to the wright path.
Thank you for making my life so much easier. You’re an angel
Dolores. Glad I could help .
Excellent help, thank you so much for the speed and details of the lesson. You were a huge help!
Hi
thanks a lot. the video is excellent and you teach it in a very easy way. God bless you
I want to tell you something, these answers on the sheets could be entered by the user behind the scene. Example: when the user is answering the survey, answers would populated plus calculation at the same time. Then when you need to open/visible the answers, you open it with a password. I made a project like that 20 years ago. I lost the file, backup when I moved to another dept at my job and I don't have the file. All I remember was al lot work, but very rewarding. I had to transform the questionnaire in word into excel, exactly the way it was, then I applied codes to feed the behind scene answers sheet. The result is a breeze. I think the code was like this: if q1 is 1, or 2, 3 than do this, if q2 is this and that insert this and that.
Super.. Now im learning some basic of data analysis
I learn a lot from here.Thank you so much
i am disappointed that such a wonderful video has such few likes😢😢
You are too kind :)
This was extremely helpful. Thanks a lot!!
This was a huge help! Excellent work mam.
Thank you SO much for posting this!!!!!
Your instructions were very helpful. I learned a lot! Glad I can do this on my own in the future.
Mindy Ciofani Great.
Hi Deidre,
I agree with everything here, but when you are naming those columns at 4:20 onwards in this video, my heart broken seeing you naming all those columns one by one.
Instead you can select all those columns i.e. B1:O26 whatever and press Ctrl + Shift + F3, it will ask you whether you want to name those columns using their respective headers, say OK for that. Bang...you already named 15 columns automatically without wasting time on selections and naming.
Very useful video. Thanks...cheeers from India.
Art is an EXPLOSION......
Fentastic video👌, its really good and very useful for students👏, I am really like❤ this video Tnq....... Vry much guy...😊😊😊
Thanks a lot. Just what I need to start my analysis. Any video on comparative analysis please?
No, afraid not.
Thank you this was very helpful allowed for me to complete my assignment
Thank you so much. Very clear and to the point.
This was really helpful. Thank you.
Really thankful for this video...It has helped me alot..
Thank you a lot, it was very helpful for a survey that I did for my thesis!
Thanking for saving my MARKS!! Great job done explaining this matter
Thanks... It helped me a lot. This is a great tutorial. I have a urgent quarry... Here you demonstrated us about one answer against one question. Please would you tell me that, if there is more than one answer against one question how to input those value and process data...
If will be a great help to me if you reply shortly.
+Tanvir Klion
I will also like to know how to input those with more than one answer and process the data.Did you come across the video? if you did please share. I really need that.
Many Thanks.
This was helpful indeed.
Is there a method/formula to compile all the different sheet (questions) into one data or table?
Will be good to know.
Regards.
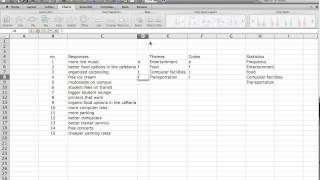
Not quite sure what you mean Sunil. At 1.37 on the video there is a table with all the results.
There is no way to chart all data in some sort of chart that I know of.
Maybe I am misunderstanding your question.
Regards,
Deirdre
Thank you so much.Ur tutorial is exactly what I needed!
Wow what a good tutorial! Thank you so much for posting it, believe it'll help me a lot!!
Do you have any tips on coding an open question..?
I love u so much ur video was my last minute saviour❤️❤️
This video was very useful, Thank you .
thank you so much for the info..this is really helpful. i wonder where can i find your other videos pls? thank you
This is really in informative and useful tutorial. Thank you very much for sharing and teaching this to us. Later, I have a problem if possible to suggest of recommend any video of you, or you can teach me here. The problem is, if the question has a multiple options to be chosen (For instance, if the question asked to the respondent to chose any option or answer you think is suitable, in this case the respondent may chose more than one option) so how to get such results from a survey (Questionnaire)? This is not applicable for all questions but just few in the whole survey.
I thank and appreciate in anticipation.
You have to think about how you want the chart to look in Excel. You would probably like a chart that shows the total number of people that chose Option A and B and C...
I would have a separate column (like a separate Question) for each possible Option. For each person that chose a particular Option I would type a 1. I would then total each column (adding up all the 1s) and use the headings and these totals only for the column chart.
Try this video
Datasets - Entering multiple-answer items in excel
+Deirdre Macnamara
I have used this video,it helped me a lot .But it does not show how you create the graphs or pie charts after entering the data. Does one follow the same process as from your video or its different. what do i use for analysis? Need your help
Hi
In Excel the creatina of Pie charts and Bar charts are really the same as Column charts. You just select Pie instead of Column. I have an older video doing pi charts th-cam.com/video/lQV6gz03q9w/w-d-xo.htmlm40s thay might help.
Deirdre
As indicated i have entered multiple answer items in excel and i am now stuck with the next step of analysing the data. coming up with pie charts. Do i follow the same process as doing pie charts for single answers? Do i use the countif?
Just want to ask, im doing a questionnaire and i have one question where they rank three options from 1-3, how do i pu t that in a questoinnaire because its not just one answer, they all put three topics in a ranking order from 1-3 (3 being highest)
thank you so much , your video is very relevent !
tks. very clear and helpful. COUNTIF, lookup, sumproduct, pivot table, all are powerful.
Thank you for the upload. This is very helpful. So nice.
This video helped me so much! However, I have a question, if I add another question or change the information to the questions on the Data worksheet, will it show up on the other worksheets with the charts?
+Eliza S. The changes on the data sheet will show. However if you add a question you will have to do new naming and countifs/charts.D
+Deirdre Macnamara Thank You.
thank you. helped a lot with quickly crunching some survey data
nice lesson, thanks for sharing
you saved my day, I would have failed my exams. Thanks a ton
Great
Can this be done for demographic questionnaires?
hello was wondering how i could continue to add data and have the formulas add it up as data gets added to the spread sheet
OSCAR RAMIREZ
All you do is select a larger area for your range in in your countif function area with space to add more data. It will be ignored when blank and will only be counted as you add data.
When i put on the filters in data and filter out certain things the pdata in the charts doesnt change. What am I doing wrong?
Basically i'm trying to analyze a survey and i have race, age, town that they grew up in, education, and 7 questions that are agree to disagree. Do i add all of that data into a single spreadsheet? or one for the demographic and one for the agree to disagree since it's several answers to several questions.
I would put all the raw data from the questions on a single sheet and then just to make the graphs easy to find I might put the graphs on separate tabs in the one file.
Hi , I am using this method to analyse my findings. Can you please advise what type of technique is this ? What is the name of this analysis ?
Thank You Very much.
+lemonade100100
You are creating Frequency tables.
+Deirdre Macnamara
This video has been very helpful. I have used it to analyze my findings which was just one variable.I have just finished entering my data which had questions with multiple variables. I am now stuck as i don't know how to convert this into pie charts or bar graphs.How can i do this?
Thank you so much for this tutorial.
What if there are multiple answers for one question, how should i enter data then?
treat them as separate questions
Great video! I was able to use this at work. Question what formula would I use if I wanted to know the names of the people who for example rated question 1 a 4=strongly agree. Any help would be greatly appreciated.
Hi I think what you are looking for is some of the database tools so you could use the "Data" | "Filter" option and just select Strongly agree. D
Thank you for sharing the knowledge :)
Glad to help..
Hey, I wanna analyze data for 10 participants ,compare right , left foot to find out which foot is better , in antropostero ,mediolateral,
can help me how begin analyze this data ?
This was very helpful thanks. But wont a pivot table do the same thing?
Yes. You can do a lot of things in many different ways in Excel. The point of this video is showing you how to enter the information into Excel and how to get a graph with very few Excel skills.
Deirdre Macnamara yes. This was very helpful regardless. Thank you.
Deidre, as already echoed below, thank you for this easy to follow tutorial. Question for you though, do you have an equally easy to follow tutorial for instances where respondents may choose more than one option?
No. Afraid not. Each option should be stored in a separate column. I think the only easy way to do that is to show each option as a separate chart or just chart the totals for each option. Hope that helps.
Is it possible filter the results by another result from the same spreadsheet? I need to segment the results by age as well
Yes
Use Data Filters. Click on the Data Tab. Then click filters.
Deirdre Macnamara Many thanks. Will try it out.
Unused google forms and as people answered my survey it calculated the results . I have answers in % and in numbers! All I need is to get the men mode standard deviation etc! How do I do that ?
Excellent presentation. Thanks alot.
This has been helpful. Thank you!
Do we have to write the scores for each question manually 1 by 1? Or is there a shortcut way of doing it?
If you have used a paper based questionnaire then yes you have to do it manually.
@@deirdremacnamara okay, thank you
this is quite helpful , thanks a lot
I have followed your steps and everything went well until the countif selection at 7:58. When I "ok" it says I have "not enough arguments". I have tried to everything over again and again and still the same answer. What is the problem here?
Hi Stephen,
Not sure what the problem is
Countif has 2 arguments;
- Range
- Criteria
Does it recognise your range? (see video at 7:36) (Look at the right of your dialog box (pop up window) and do you see something like (2,6,7,2,3,4,1,1,2,4,5,)
If it doesn't understand the "name" you can manually select the data
Does it recognise your criteria? If you used a cell reference like C1 does it know what to count. See video and I have highlighted at 7.57.
Hope that helps
Deirdre
Deirdre Macnamara
Thanks for the response. It wasn't recognising the range at first, but I have managed to do it at last.
Thanks again and keep up the good work
Steve
Thanks for the video. Can you aid me out with how to enter open ended questions into excel data?
Gerald Owusu Wish I could help here but I don't know of any easy or automatic way to do this in excel.
I have a question, it may seem unrealistic to show every percentage of each question. In my case, my survey has 43 questions in total, the respondents were only 9 of them. Therefore to show all 43 questions with pie charts or column bars will take too much space on the final product: my graduate thesis. Is there a solution to generalize the results which I can include on my thesis? (not having to convert every single questions into charts). I have 3 choices per question though.
If you can do it with pen and paper you can usually do it in excel. If it is always the same 3 options for each question then a stacked bar might work.
Thank you sooooo much for this video, it was super helpful.
Is the countif method the only way to measure frequency in Excel?
No. You can use a pivot table. see th-cam.com/video/rCk9jFdv8SY/w-d-xo.html
How to deal with multi item response? like "check the box that apply"
Thank you so much. it helped me to do my research project
+Loshiye Sindiyo Great.
Wow, thanks! Not afraid of Excel any more!:))
Hi Deirdre! Thanks for your help. Q: What do you do if your survey responses are not mutually exclusive?
I have a survey question that reads: "Which community groups are you active in, check all that apply" and I coded each community group with a number. When I code a response "1,2," for example, the countif function doesn't count any community groups at all / pick up the response.
Any advice or follow up tutorials on this would be wonderful! Thanks!
Hi Melissa
I would have a seperate column for each possible group and only 2 options 1 for yes and 0 for no. then you can just sum all the yes answers.
Hope that helps
Hi. On my Mac, when I right click the option 'Define Name' doesn't come up. Any suggestions?
+Marco Briglia
You can define names using the ribbons as well. Select The Data Tab and in the "Defined Names" section in the middle click on Define name.
D
I have followed all the steps and all is working well; however I am having an issue with the number of responses. I have received 22 survey responses and have input all of the data. After setting up the all of the countif functions it is only recognizing 21 survey responses. I have double checked to make sure each survey was entered properly. I definitely have 22 rows of data.
please can you insert the link of the data sheet i will be v grateful
Thanks it was helpful 👍🏻
8:09 how did you drag down the formula??
Hi Jayke, I just used the fill handle (Solid black cross in the bottom right corner of the selected cell). Mine worked because the data that was being examined (answers to question 1) was held steady because it was "named" and the thing being looked up (answer options) was a plain cell reference that came down with me. Hope that helps
Huge help! Great job.
Big help! Thank you very much.
Its a great tutorial. Thank you!
This was really helpful! Great expectations, thanks a lot !🙌😀
Thank you so much Deidre Macnamara. it helped me alot in doing my research project.
research projects can be tough so glad to help.
i have raw data and i need to interpret it according to the objectives how do i go about it?
Ifesa
Not really sure what you are asking.
This was really helpful! Thank you so much.
I just had a question: If I wanted to do a further analysis e.g. chi2 test, can you use the numerical equivalent e.g. father q1: 1= No education compared with Q3 sibling 1=yes ?
Would the numerical number be valid when doing correlation test e.g. does having your father have an undergraduate degree mean your sibling is also more likely to as well?
+rpk12 You would have to run the chi squared test to tell whether it was more likely. See this video th-cam.com/video/yoRQEZVKrJw/w-d-xo.html
It's helpful to whom it may concerns
Great teacher!
Jose Rodrigo Nino Nieto thanks
What if you have more than one number being the question answers? For example: Results_Q_1= 1,2,4,6,8
What if the question is answerable with multiple answers
Each answer goes in a separate column
Excellent...Thank You very much
Extremely good!
Thank you, this was helpful
thanks for this! Has really helped!
How can I enter 2500 data from pen-and-paper questionnaires with over 60 variables fast into excel? Please, help!
Each of the 2500 questionnaire are on separate rows and each variable is a separate column. Remember the variables should be number coded with for example Age 0-10 typed in as 1 Age 11-20 typed in as 2 etc.
Regards
Amazing and helpful
Best Tutorial Thank u. :)
Best video ever
What if we already have the total number of respons per question?
Then just use the charting tool.
@@deirdremacnamara Will it still give the mean?