Helped me for my data analytics class. Very new to R and this step by step tutorial was wonderful. My assignment was actually to use the Iris data. I learned so much.
Great Work. I appreciate your use of the Iris data set. I'm familiar with the data set. That means I can focus on what you have to say about K-Means clustering without having to learn the details of a new data set. Thank you.
Excellent video. It provided simple steps to follow. I was working with the faithful dataset in the R distribution. Ones eye could see the two clusters. I applied your instruction but used the faithful data and was able to break out the two existing clusters. These are almost intuitive. Thanks
I'm experiencing similar problem.Can anyone help with this,especially on the part when doing a plotting comparison with original data ?However if you use colRamp,it outputs the plot however colors disspears
Hi Influxity, really helpful thank u very much. And I have a question if u could ans me please, is there a way to specify the initial centroids and specify the type of distance we can use?
quick questions. 1) would you standardize the data turning all responses into z-scores? 2) cluster generation is not criterion based? As it stands now, the clustering is based on finding the greatest difference and similarities simultaneously based on the wanted number of clusters; the user then has to then compare the clustering results to response variables. the closest match infers a possible difference which is more than likely tested with an ANOVA to prove significance?
hello, can you help me? im new in using r. i follow your tutorial but i got an error. results = kmeans(Iris.features, 3) Error in do_one(nmeth) : NA/NaN/Inf in foreign function call (arg 1) In addition: Warning message: In kmeans(Iris.features, 3) : NAs introduced by coercion
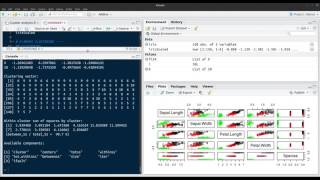
what does cluster means describe for a particular observation? like we have to consider a whole row as a complete record. So , how to interpret the cluster means as coordinates of centroid or mean distance between centroid and data points?
When i try to check the actual data using "plot(Iris[c("petalLength","petalWidth")], col = Iris$class)" or "plot(Iris[c("sepLength","sepWidth")], col = Iris$class)", I get an error saying "Error in plot.xy(xy, type, ...) : invalid color name 'Iris-setosa'". Not sure how to fix this
how can you calculate F1-Measuare , precision, recall and entropy of the clustering result? additionally does it support sparse data? for text clustering sparse data is a must
You can evaluate clustering algorithms with other techniques like: Calinski Harabasz Evaluation, Davies Bouldin Evaluation, Gap Evaluation (Distance from center), Silhouette Evaluation. See www.mathworks.com/help/stats/clustering.evaluation.clustercriterion-class.html
I understand what you're saying and I'm sorry you feel that way. The point of the video is to understand k-means and see how it's used in R. The Iris dataset fits k-means well as it has nice clusters that are in lower dimensions. It's also a familiar dataset and easy to get and work with. This allows viewers to focus on the commands and outputs of the algorithm in R and get a better understanding of the algorithm in general without having to worry about more complicated datasets and edge cases. I'll work with some different datasets in future videos but want to pick them so they add to understanding the main point of the video.
+mightyvel vel well you are just at the beginning. you will gross out with seeing how primitive examples and algorithm equations without a single example :D
Question: How can we upload the kmeans results to the original data set? I want to compare reality to the predicted class for each entity. in other words. I'd like to see the predicted class results in the original spreadsheet "iris".
If it is still helpful, here is a version using data.table package: ------------------------------------------------------------------------------------------------------------------------------------------------- require(data.table) iris.features
Can check the file you're reading in? See if it has non-numeric or missing values. Look to see if you have an extra line, Null, or something like 1.2e+10. Let me know what you find and we'll go from there.
Even though it's an old video, a few important parts are intentionally left out. He says that you need to 'normalize your data' and remove any rows that are missing values. Unfortunately these instructions are not given, this only complicates how to properly complete this task from start to finish. It's only a couple lines of code to do these operations yet he doesn't show how to do it.
Hi, what I did, is to download "iris.data" and open it in a text editor like Notepad++, add a header, just write at the first line "sepal.length","sepal.width","petal.length","petal.width","class", it is required for a csv file. Then save it as "iris.csv", and now you can follow the video :D


Helped me for my data analytics class. Very new to R and this step by step tutorial was wonderful. My assignment was actually to use the Iris data. I learned so much.
You explained this in plain english, which I really appreciate!! Great video, thank you
Great Work. I appreciate your use of the Iris data set. I'm familiar with the data set. That means I can focus on what you have to say about K-Means clustering without having to learn the details of a new data set. Thank you.
Thank you
so easy to me, with your tutorial
Great video. Explained in an easy to understand manner, compared to some of the more cryptic R training material I have looked at.
Excellent video. It provided simple steps to follow. I was working with the faithful dataset in the R distribution. Ones eye could see the two clusters. I applied your instruction but used the faithful data and was able to break out the two existing clusters. These are almost intuitive. Thanks
Simple and very good for beginners.
4:04 Why dont you normalize the data before kmeans ?
Is there some rules concerning the range of attributs and extra relationship ...
Error in plot.xy(xy, type, ...) : invalid color name 'Iris-setosa' thats the error which appears everytime....help me out with this
I'm experiencing similar problem.Can anyone help with this,especially on the part when doing a plotting comparison with original data ?However if you use colRamp,it outputs the plot however colors disspears
the codes aren't working for mine it shows error.Can you help me?
Thanks for tutorial. Why didn't you normalize or scale the data first?
Very helpful! Thank you, god bless you sir.
Hi Influxity, really helpful thank u very much.
And I have a question if u could ans me please, is there a way to specify the initial centroids and specify the type of distance we can use?
quick questions. 1) would you standardize the data turning all responses into z-scores?
2) cluster generation is not criterion based? As it stands now, the clustering is based on finding the greatest difference and similarities simultaneously based on the wanted number of clusters; the user then has to then compare the clustering results to response variables. the closest match infers a possible difference which is more than likely tested with an ANOVA to prove significance?
use scaled_iris = scale(iris.features)
It's very great now I understand how is it work . But there's one question how if we make it work with semantic analysis and topological parameters.
Nice video. You said that the algorithm reinitializes during each run. What does that mean?
hello, can you help me? im new in using r. i follow your tutorial but i got an error.
results = kmeans(Iris.features, 3)
Error in do_one(nmeth) : NA/NaN/Inf in foreign function call (arg 1)
In addition: Warning message:
In kmeans(Iris.features, 3) : NAs introduced by coercion
Initially, I too got this error. Then, I tried this and it worked fine.
x
although a bit late try this
results
God bless u for this ingenious n intuitive posting...keep up the good job. More videos please.
Simple and up to point. Thanks!
what does cluster means describe for a particular observation? like we have to consider a whole row as a complete record. So , how to interpret the cluster means as coordinates of centroid or mean distance between centroid and data points?
Which similarity measure is used here to perform the k-means clustering..??? And how this default measure can be changed in the Rstudio??
Where did you download the Iris.CSV? I don't see that anywhere on the website. Please assist.
what to do when you retry to run the coding with the same data and the results of the cluster have different observations / cluster??? help please
When i try to check the actual data using "plot(Iris[c("petalLength","petalWidth")], col = Iris$class)" or "plot(Iris[c("sepLength","sepWidth")], col = Iris$class)", I get an error saying "Error in plot.xy(xy, type, ...) : invalid color name 'Iris-setosa'". Not sure how to fix this
Hi Influxity. You mentioned that you can estimate how many clusters there should be. Can you cover this, or have you covered this elsewhere?
Thank you, very well illustrated
How would this be done with the mnist_dataset? It's got 20,000 rows and 700+ columns
Could you please provide implementation of different version of spectral clustering using R ?
how can you calculate F1-Measuare , precision, recall and entropy of the clustering result? additionally does it support sparse data? for text clustering sparse data is a must
You can evaluate clustering algorithms with other techniques like: Calinski Harabasz Evaluation, Davies Bouldin Evaluation, Gap Evaluation (Distance from center), Silhouette Evaluation. See www.mathworks.com/help/stats/clustering.evaluation.clustercriterion-class.html
Very informative video. Thank you.
Error in table(Iris$class, results$cluster) :
all arguments must have the same length
how to fix this?
Check if class is not a factor by levels, if not change it to factor.
how can i train some data using k means and then test some data using that? and bit explaination about accuracy and all other parameters...!!!
could u please upload implementation, I want to make changes in algorithm and see the results
What a beautiful voice!
thanks for providing this good videos
I am getting 3 clusters each of same size-50 obsv on each cluster.Somethinh wrong.Any comments?
'
Thank you very much, it is verry helpful tuto..
am tired of seeing this iris data... lots of videos using the same...why there is no real world examples used .??
I understand what you're saying and I'm sorry you feel that way. The point of the video is to understand k-means and see how it's used in R. The Iris dataset fits k-means well as it has nice clusters that are in lower dimensions. It's also a familiar dataset and easy to get and work with. This allows viewers to focus on the commands and outputs of the algorithm in R and get a better understanding of the algorithm in general without having to worry about more complicated datasets and edge cases. I'll work with some different datasets in future videos but want to pick them so they add to understanding the main point of the video.
mightyvel vel iris data IS real world example but may not be in your area of work :)
+mightyvel vel well you are just at the beginning. you will gross out with seeing how primitive examples and algorithm equations without a single example :D
Bish Sinha ftv6
It is very sad to hear that Irises are not considered to be part of the real world.
Thanks for doing this! I subscribed and liked. Also do some more similar functions in R
Thank you. I'll work to get some more videos up soon.
Question: How can we upload the kmeans results to the original data set? I want to compare reality to the predicted class for each entity. in other words. I'd like to see the predicted class results in the original spreadsheet "iris".
If it is still helpful, here is a version using data.table package:
-------------------------------------------------------------------------------------------------------------------------------------------------
require(data.table)
iris.features
Also use 'confusionMatrix' to check how well the model has predicted.
This is awesome. Thank you !!!
table(Iris$class, results$cluster) is not clear. Please explain.
Dear Influxity, I tried to do the same steps that you do, with the same DB, in R Gui (32 bits) , but when I execute: results
Can check the file you're reading in? See if it has non-numeric or missing values. Look to see if you have an extra line, Null, or something like 1.2e+10. Let me know what you find and we'll go from there.
Influxity Hii!!
If the file has missing values, what should i do to fix this?
thank you for this video, it helps me a lot!! :D
Hi Marco Antonio Miranda Hernández , I had this problem initially as well and it turns out there was an error in my csv. file from copy+pasting.
although very late try this
results
what is vector in kmean clustering?
This is amazing learning
Thank you!
It was helpful
fantastic mate!
Amazing job! Thanks
Thank you
i get when k=3
then cluster is formed 50,61,39 is it correct?
kmeans does some random initialization at backend which results in slightly different outcome every time you run it.
CAN ANYBODY TELL ME HOW TO FIND THE DEFECT CLUSTERS IN THE ABOVE DATASET
How do I scale the data?
How to analyze Cluster means? I don't understand it.
Thank you sir!
Can someone do a k-modes as well? For categorical data?
Since, k-means doesn't work for categorical I guess.
What is the issue in replacing 'kmodes' function in R? For dataset with both categorical and numerical variables, use K-prototype (kproto)
how do u download the data from archive.ics.uci.edu
Even though it's an old video, a few important parts are intentionally left out. He says that you need to 'normalize your data' and remove any rows that are missing values. Unfortunately these instructions are not given, this only complicates how to properly complete this task from start to finish. It's only a couple lines of code to do these operations yet he doesn't show how to do it.
how to download iris data set
Good Job
thanks
Nice video.. Voice fades (not often but can be avoided)
thanks a mil :D
good
I liked the video. But the interpretation part could be wider. Thanks though,
Cheers,
nice
I am not able to download database!!!!! I'll go crazzy
Hi, what I did, is to download "iris.data" and open it in a text editor like Notepad++, add a header, just write at the first line "sepal.length","sepal.width","petal.length","petal.width","class", it is required for a csv file. Then save it as "iris.csv", and now you can follow the video :D
iris is there in R by default. jz key in "data(iris)" and you are in.
all of you all who are having " Error in do_one(nmeth) : NA/NaN/Inf in foreign function call (arg 1)" problem
instead of
results
To keep your voice audible, do you have to pay extra taxes?