Yeah Rstudio can be kind of trippy at times. I assume you’re referring to the graph section in R? Try expanding that window for bigger pictures - it’ll expand
Thankyou for your explications. I didn't have no idea of Clusters until i discovery your Video. Please how can we manage the clusters with dimension of the data
If you just have one dimensional data and were to plot it, the data points would be on a "number line". And, you probably won't get a ton of value from that unfortunately.
Thankyou for the answer. I'm working with daily returns financial data from an index, and I wanted to apply cluster analysis to identify outliers. Do you kinda see what I mean?
@@hermanndeumeni2731 Ahh yes. Pricing data (Price vs Dates). You can run a variety of outlier tests on number data. Though, I have never seen clustering used (Would be an interesting thought experiment though).
I am not 100% sure what the Tocher method is, but it seems like it is an equation? (after a quick search?) If that is the case, you could perhaps plug in the formualic equation as one of the optimizer functions within an already built library for hierarchical clustering.
@@SpencerPaoHere actually i have data for around 30 genotypes in an augmented design without replication. Now i want to check the genetic diversity, and for k means cluster using tocher method, it is not possible to analyse data without replications. Someone suggested me about the hierarchical clustering method, if possible can you upload a video about how to do data analysis of unreplicated data in augmented block design using tocher method in r studio... It will be very helpful.
@@happysirji Very interesting. It sounds quite niche. Though, within genetics, have you looked into pairwise genetic diversity? That might be better suited to what you are doing.
@@SpencerPaoHere i don't know about that. How to do that? Please do something for D^2 statistic using tocher method. It also needs a replicated data but my data is not replicated because of augmented block design. Suggest some alternative for that.
@@happysirji There is a really neat paper for the pairwise idea. besjournals.onlinelibrary.wiley.com/doi/10.1111/2041-210X.12067 Regarding the Tocher method, I am not super familiar with the approach, and I could pencil in the topic but it'd probably not come out anytime soon due to me studying and understanding the method.
Very helpful video, Spencer! I loved it! Congratulations and thank you very much! Well, I have 100 texts to cluster. 50 of them are from a magazine X and the others 50, from a magazine Y. We don't know who wrote them, because at the time they were written (beginning of the 20th century), people used to write under pseudonyms and used to write on both of these magazines. Each text were tagged (for pronuns, relative clauses, stances etc.) and each of these features were normalized to 1000. Two questions, if you dont mind: 1) which type of cluster is the best fit for this kind of data? K-means or HC? And regardless the kind of cluster to be chosen, should I scale my data as well? Even if each feature has been normalized to a frequency of a 1000 words? Thank you very much!
Hi! I'd recommend that you try out both and see what happens. I'd be interested to see what you'd get from either model. I'd try out the K Means approach first since there is a ton of documentation on the matter. Using K Means as a base, you can use HC to see how the performance compares. When dealing with multi-dimensional data, you should always scale your data since the distance algorithm(s) applied will be dependent on the data observations in the multi dimensional plane, thereby outputting different results. (K means uses Euclidean distance)
Hi Spencer !! Amazing video, thanks for sharing, may I ask you something? Can you do a Hierarchical Clustering using numeric and categorical variable? Example, I have the next data: product_name, price, brand, package and so on. I would really appreciate your help
Hi Spencer Pao, I have to use the Hierarchical allocation of carbon in plants to put values in the crop model, and for that purpose, I have biomass plant data to be allocated to different parts of the plant but I do not know How to do this because each part required its own flow. So do you have some idea about this Please share if there is anything with you.
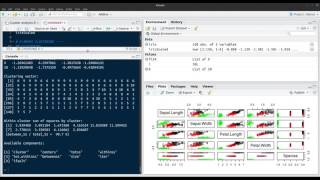
Question: I understand that the 2 plotted dimensions are chosen using principal component analysis. Is there a way to find out which dimensions these are since the plot only says dim1 and dim2?
Since this PCA is used in the backend, the dim1 and dim2 features are a combination of all the features that explain the most variance. So to answer your question -- not really (unless something new appeared to address this)
@@SpencerPaoHere By adding more variables to cluster, I see the explained variance of the PCA dropping in both dimensions: does this mean the variables shouldn't be added to begin with?
@@LouisJonckers Not necessarily. More features add additional variance to your overall dataset. You'd have to do further analyisis on whether the PCA dimensions you are utilizing are explaining your wanted variance. (can do a table test) You can also combine multiple PCA dimensions together to have a similar variance explained were you to see a drop in variance in just 2 dimensions..
[1:4] is an index in R syntax. In this case, it is getting the first 4 columns. This is equivalent to [,1:4]. If you want specific rows you can query [1:4,1:4] (first 4 rows and 4 columns) So, 1:4 is like saying 1,2,3,4
@@happysirji If by varieties, you mean by "columns" [1:48] should be fine. if by rows and all columns? [1:48,] You can also test this out in the rsudio console to make it more intuitive.
@@SpencerPaoHere no i am taking the varieties/ genotypes in 1st column. Like in the video there were 3 varieties/ genotypes = setosa, vesicolor and virginica. You set them in the end. I have added them in first and then in next 12 columns the traits. So I should do [1:48,1:12] or [1:4,1:4] or [1:48,1:48]. I am confused in this. How to decide what to write in ratio?
@@happysirji In terms of R syntax, it'd look somethin like dataframe[Starting Row Index:Ending Row Index, Starting Column Index: Ending Column Index] Does that make sense?
@@SpencerPaoHere Hi, I am currently trying to use this in feature selection. Do you know any way to pick the correct number of clusters using some R package?
Hello, I have a larger set of data around 31192 observations and 13 variables, i want to do the K and HC analysis? Can ou please help me regarding this, I tired a lot but couldn't? Is it possible can you to give me your email?


Not a fan of data science subjects however you've done a great job explaining concepts!
Wow, simple and great, thanks Spencer!
Really helpful!
I need this man to be my teacher
Thank you so much!
Thankyou this was helpful.
thanks a million
Hi Spencer, thanks for the quality content and delivery method.
my visualization overlaps, how could fix it?
Yeah Rstudio can be kind of trippy at times. I assume you’re referring to the graph section in R? Try expanding that window for bigger pictures - it’ll expand
Thankyou for your explications. I didn't have no idea of Clusters until i discovery your Video.
Please how can we manage the clusters with dimension of the data
If you just have one dimensional data and were to plot it, the data points would be on a "number line". And, you probably won't get a ton of value from that unfortunately.
Thankyou for the answer.
I'm working with daily returns financial data from an index, and I wanted to apply cluster analysis to identify outliers. Do you kinda see what I mean?
@@hermanndeumeni2731 Ahh yes. Pricing data (Price vs Dates). You can run a variety of outlier tests on number data. Though, I have never seen clustering used (Would be an interesting thought experiment though).
That video was very good Spencer. Is it possible to do hierarchical clustering using Tocher method?
I am not 100% sure what the Tocher method is, but it seems like it is an equation? (after a quick search?)
If that is the case, you could perhaps plug in the formualic equation as one of the optimizer functions within an already built library for hierarchical clustering.
@@SpencerPaoHere actually i have data for around 30 genotypes in an augmented design without replication. Now i want to check the genetic diversity, and for k means cluster using tocher method, it is not possible to analyse data without replications. Someone suggested me about the hierarchical clustering method, if possible can you upload a video about how to do data analysis of unreplicated data in augmented block design using tocher method in r studio... It will be very helpful.
@@happysirji Very interesting. It sounds quite niche. Though, within genetics, have you looked into pairwise genetic diversity? That might be better suited to what you are doing.
@@SpencerPaoHere i don't know about that. How to do that?
Please do something for D^2 statistic using tocher method. It also needs a replicated data but my data is not replicated because of augmented block design. Suggest some alternative for that.
@@happysirji There is a really neat paper for the pairwise idea. besjournals.onlinelibrary.wiley.com/doi/10.1111/2041-210X.12067
Regarding the Tocher method, I am not super familiar with the approach, and I could pencil in the topic but it'd probably not come out anytime soon due to me studying and understanding the method.
Very helpful video, Spencer! I loved it! Congratulations and thank you very much! Well, I have 100 texts to cluster. 50 of them are from a magazine X and the others 50, from a magazine Y. We don't know who wrote them, because at the time they were written (beginning of the 20th century), people used to write under pseudonyms and used to write on both of these magazines. Each text were tagged (for pronuns, relative clauses, stances etc.) and each of these features were normalized to 1000. Two questions, if you dont mind: 1) which type of cluster is the best fit for this kind of data? K-means or HC? And regardless the kind of cluster to be chosen, should I scale my data as well? Even if each feature has been normalized to a frequency of a 1000 words? Thank you very much!
Hi!
I'd recommend that you try out both and see what happens. I'd be interested to see what you'd get from either model. I'd try out the K Means approach first since there is a ton of documentation on the matter. Using K Means as a base, you can use HC to see how the performance compares.
When dealing with multi-dimensional data, you should always scale your data since the distance algorithm(s) applied will be dependent on the data observations in the multi dimensional plane, thereby outputting different results. (K means uses Euclidean distance)
@@SpencerPaoHere , thank you very much! I'll try both of them!!
Hi Spencer !! Amazing video, thanks for sharing, may I ask you something? Can you do a Hierarchical Clustering using numeric and categorical variable? Example, I have the next data: product_name, price, brand, package and so on. I would really appreciate your help
You most certainly can! It’d just be a matter of converting the categorical data to numerical such as one hot encoding
Hi Spencer Pao, I have to use the Hierarchical allocation of carbon in plants to put values in the crop model, and for that purpose, I have biomass plant data to be allocated to different parts of the plant but I do not know How to do this because each part required its own flow. So do you have some idea about this Please share if there is anything with you.
Hmm I’m not sure I follow all too well. What are you trying to model? It seems you’re trying to fit a model to a problem.
Question: I understand that the 2 plotted dimensions are chosen using principal component analysis. Is there a way to find out which dimensions these are since the plot only says dim1 and dim2?
Since this PCA is used in the backend, the dim1 and dim2 features are a combination of all the features that explain the most variance. So to answer your question -- not really (unless something new appeared to address this)
@@SpencerPaoHere By adding more variables to cluster, I see the explained variance of the PCA dropping in both dimensions: does this mean the variables shouldn't be added to begin with?
@@LouisJonckers Not necessarily. More features add additional variance to your overall dataset. You'd have to do further analyisis on whether the PCA dimensions you are utilizing are explaining your wanted variance. (can do a table test)
You can also combine multiple PCA dimensions together to have a similar variance explained were you to see a drop in variance in just 2 dimensions..
Hi spencer, would it be possible if you could help me with my Clustering? its for my thesis.
What's the question?
I have another query Spencer. In iris_data = iris(1:4)
Here what is 1:4, can you please elaborate.
[1:4] is an index in R syntax. In this case, it is getting the first 4 columns.
This is equivalent to [,1:4].
If you want specific rows you can query [1:4,1:4] (first 4 rows and 4 columns)
So, 1:4 is like saying 1,2,3,4
@@SpencerPaoHere ok. So for the data of 48 varieties, i should do 1:48 ? Or i can go with 1:4.
@@happysirji If by varieties, you mean by "columns" [1:48] should be fine. if by rows and all columns? [1:48,]
You can also test this out in the rsudio console to make it more intuitive.
@@SpencerPaoHere no i am taking the varieties/ genotypes in 1st column. Like in the video there were 3 varieties/ genotypes = setosa, vesicolor and virginica. You set them in the end. I have added them in first and then in next 12 columns the traits. So I should do [1:48,1:12] or [1:4,1:4] or [1:48,1:48].
I am confused in this. How to decide what to write in ratio?
@@happysirji In terms of R syntax, it'd look somethin like dataframe[Starting Row Index:Ending Row Index, Starting Column Index: Ending Column Index]
Does that make sense?
Does this tutorial applies also to fastcluster ?
Yes! The real difference is that fast cluster uses the most optimal algorithms (hierarchical schemes), so you may see a speed up.
@@SpencerPaoHere Hi, I am currently trying to use this in feature selection. Do you know any way to pick the correct number of clusters using some R package?
Hello, I have a larger set of data around 31192 observations and 13 variables, i want to do the K and HC analysis? Can ou please help me regarding this, I tired a lot but couldn't? Is it possible can you to give me your email?
Ni jao