How to build Scatter plot in Tableau | Tableau Charts

ฝัง
- เผยแพร่เมื่อ 12 ก.ย. 2024
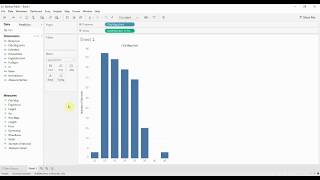
- This video provides a step-by-step guide on how to build a scatter plot in Tableau. We use a data source from Kaggle and work through how to customize the visual representation of your scatter plot.
In Tableau, you create a scatter plot by placing at least one measure on the Columns shelf and at least one measure on the Rows shelf. If these shelves contain both dimensions and measures, Tableau places the measures as the innermost fields, which means that measures are always to the right of any dimensions that you have also placed on these shelves. The word "innermost" in this case refers to the table structure.
Join this channel to get access to perks:
/ @tableautim
#tableau #salesforce #analytics #data
Follow me on Twitter: / tableautim
My recording gear & what's on my desk. kit.co/Tableau...
My website: www.tableautim...
My Screen Annotation Tool: j.mp/3HWc4Mj
My technology Channel: j.mp/3F0d28f
Share feedback and Suggestions: tableautim.can... ----------
(C) 2023 TN-Media LTD. No re-use, unauthorized use, or redistribution, of this video without prior permission.


![[FULL EP.73] เปิดบ้าน 70 ล้าน "แป้ง Zbing" ยกมาทั้งญี่ปุ่น l เคหสถานบานปลาย l One Playground](http://i.ytimg.com/vi/YBnJhTt07Pg/mqdefault.jpg)

Thank you for this interesting video 🙂
Just what I was looking for, I couldn't find out how to get more than that one dot.
Great video thanks for the help
Thank you, incredible video
Thank you so much! Super helpful
Glad it helped!
Can you added the dataset here as well?
It’s the default data set in tableau. You already have it.
Approx how much data is needed to build a scatter plot like this one? 50 rows? 500 rows? 5000 rows?
Number of rows doesn't matter, the level of detail does. you could build a scatter plot with 1 row of data and one point. Scatter plot is simply one measure eon each axis and a dot for each distinct item in your data set.
@@TableauTim Thank you
@@TableauTim Is it possible to use discrete measures on the axes? Or do they need to be continuous? Can you explain the latter a bit please?
@@FaisalKhan-wf8ys Might be better to google "Discrete vs continuous Tableau" to get a better understanding of those teo terms. Discrete measures doesn't make sense int he context of tableau. You could have integers ( whole numbers) and visualise those as discrete items but having say Discrete currency value isn't really possible because a currency as number is a continuous value. I need more than a comment allows to explain it but hope that gets you going.
@@TableauTim Thank you
Brill
you are the best