How To... Calculate Student's t Statistic (Equal Variance) by Hand

ฝัง
- เผยแพร่เมื่อ 14 ต.ค. 2024
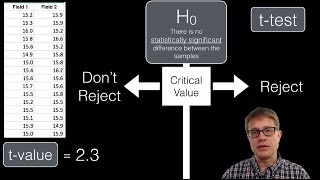
- To test if there is a significant difference between two sets of data, Student's t Test is used. In this video the t Test is for unpaired (independent) samples. An F test is conducted first to determine if variance is equal or unequal - in this example the samples have equal variance.


![โรงเรียนดัดสันดาน นักเรียนเถื่อน..!! [โรงเรียนไดเม่]](http://i.ytimg.com/vi/vRKPeXn4Fl4/mqdefault.jpg)

Thank you so much. I’ve watched almost all vids here in youtube. I love the fact that you’re using the traditional way (handwritten).
You have made my maths assignment that little bit easier. Thank you!
Struggling through the stats of my research project currently and I cannot thank you enough -
Excellent teaching! You are an angel to many a confused student!
Your video just saved my life. Thank you so much.
Thanks for this video but I believe your critical value is wrong, because you are using 2 column of data, to get degrees of freedom (1/24), you look at the F-distribution table of alpha = 0.05 (5%) and you get a 4.597 critical value, because this is the most common table to use and you are doing a one way test (i.e., a right tailed test). Just thought I would mention this! (although of course I don't know if maybe you are choosing to use an alpha = 0.1 test - just because a 0.05 is most common).
regardless, you still get an equal variance!
Hi Alex,
First - many thanks for watching my video and thank you for your feedback.
The test I am conducting is a two tail test as no direction is specified in the Null/Alternate Hypothesis (see 10:00 minutes into video). I have also specified an alpha value of 0.05 (see 10:15 minutes into video). Note that the statistics table that I am using is a t distribution, and not an F distribution. This gives me a critical value for t equal to 2.074 as I outline in the video.
Hope this helps,
Dr E.
@@EugeneOLoughlin Hello Eugene,
Thanks for your response. What confuses me is that you still did an F test at the beginning, given you used an F distribution, as you hand write in brackets, for the critical value - could you confirm this? When I look at the F distribution table online, it is around 4 not 2.82. I am aware you do a T test subsequently, but at the start you begin with an F test from what it looks like...Thanks
Alex
@@alexbraggins9152 Hi Alex,
My bad - I jumped to the conclusion that it was about the t test since this is the main subject of the video.
The F test for Equality of Variance used in this video is a copy of a separate video I created using the same data "How To... Test for Equal and Unequal Variance (F Test) by Hand":
th-cam.com/video/-ukqBN5sQSI/w-d-xo.html
At about 6:50 into the above video I show how I determined the F critical value of 2.82 using degrees of freedom (n-1=11 and n-1=11), the 0.05 F Distribution table is used.
Again - I hope this helps.
Dr E.
You are the best ever....keep it up pls Doctor
This is awesome you are great sir. The steps are so clear thank you so much for making me understand
Sir, how did you get the answer of x and xbar same as y and ybar?
Thank you Prof. This is just what I needed!!
thanks a lot sir. I just had one doubt, how do you calculate the F critical value
Thank you! Getting me through my studies :)
Professor, can you provide a link to the "choice of formula" page?
Very informative,understood very well 👍
plz also tell me, how should we calculate T value for Paired sample....if in ques, I have not provided the no. of observations(N) nor it's values. Plus If I am not provided with D(difference of conditions).
I hv in my question, only 2 Means and 2 Standard Deviations for before and after conditions. And also Correlation b/w 2 group scores (r).
hello, how should I calculate F critical if I have df=71 as numerator and df=57 as denominator???
coz even if I take avg of one value...I need at least exact value for the other.
Sir, we have two "n" so how did you get the degree of freedom? do u find for both and add them together?
Hi Agbajir Grace,
This is explained clearly at 10:20 in the video.
Dr E.
thank you so much your a great teacher very helpful! you made this easier to understand
Hi Sir, really awesome, you make statistics look so simple
This was VERY helpful. Thanks!
Tqs for give a solution to the topic of t test
How to get the critical value????
Please provide the link for download the tables u use in t test
Loved the video very informative. But I think you got the critical value wrong. I think 2.074 is for 97.5% not for the standard 95% but I could be wrong.
to find pool variance.....can we simply sum up variance of X and variance of Y and divide it with 2 .......as we get the exact answer!!!!!!!!!
himanshu narulla Only if the two samples are of equal size.
Thank you so much you are the best.
sir, please reply to my comment,
this T statistic test is about regression?
Yours sincerly, Michael S.
Hi Economist M,
The t test is about comparing the means of two populations, not regression.
Dr E.
Thank you so much
how did u get the 2.82 sir?
Hi Czarina Joyce Alvarida,
This is shown in one of my other videos - check it out here:
th-cam.com/video/-ukqBN5sQSI/w-d-xo.html
6:20 into the video I show how this value is determined.
Hope this helps,
Dr E.
Sir ,I need your help
You do not need to get spool value with such a complicated method. Simply add two S squares together and divide over 2, you will get spool.
That works only if the 2 samples have the same size. Eugene's solution is the general one and avoid confusion.
thank you!!!